Bitcoin Price Technical Analysis for 05/04/2016 – Short-Term Symmetrical Triangle
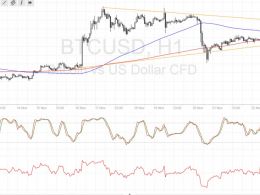
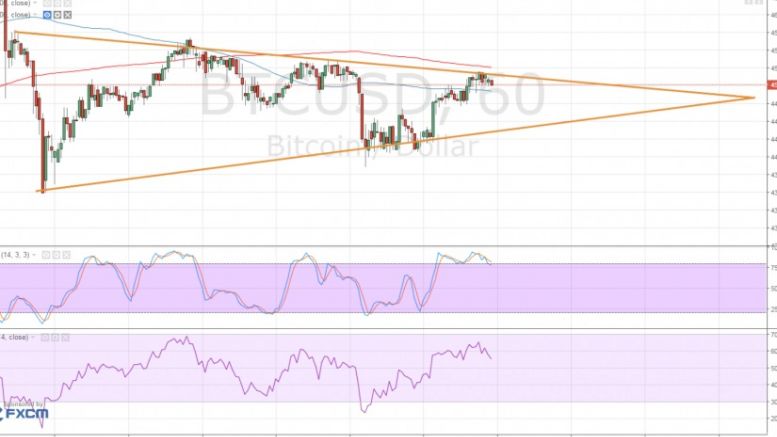
Bitcoin price is moving inside a symmetrical triangle consolidation pattern and is hovering around the top of the formation. The 100 SMA is below the longer-term 200 SMA so the path of least resistance is to the downside, confirming that the resistance might hold. In addition, the moving averages line up with the top of the triangle, adding to its strength as a ceiling for bitcoin price rallies. Stochastic is indicating overbought conditions and is turning lower, suggesting that bearish pressure could come back in play. A bit of bearish divergence can be seen, as bitcoin price made lower....
Related News
Bitcoin price just bounced off the bottom of its long-term symmetrical triangle on the daily time frame and might be due for a test of resistance. Any strong breakout in either direction for bitcoin price could set the tone for its longer-term trends for the rest of the year so keep close tabs on this triangle formation. Bitcoin price has been tossing and turning on the short-term time frames, as risk sentiment keeps shifting. On the longer-term chart such as the daily time frame, a consolidation pattern can be seen. Bitcoin price formed higher lows and lower highs since November last....
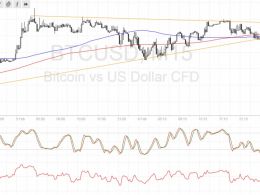
Bitcoin price is consolidating inside a symmetrical triangle formation, possibly gearing up for a strong breakout. Bitcoin Price Key Highlights. Bitcoin price has formed lower highs and higher lows, creating a symmetrical triangle pattern visible on its short-term chart. Price is currently testing support and might be due for a bounce back to the resistance. Technical indicators are giving mixed signals, although a downside break seems possible. Technical Indicators Signals. The 100 SMA just crossed below the longer-term 200 SMA to indicate that the path of least resistance is to the....
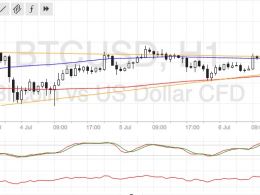
Bitcoin price is consolidating tightly in a symmetrical triangle pattern on short-term charts so a breakout could happen sooner or later. Bitcoin Price Key Highlights. Bitcoin price has been trending higher on the 1-hour time frame but seems to be hesitating once more. Price formed lower highs and higher lows visible on the 15-minute chart, creating a symmetrical triangle consolidation pattern. A breakout in either direction could ensue, giving clues about where bitcoin price could head in the long run. Technical Indicators Signals. The 100 SMA is above the longer-term 200 SMA for now so....
Bitcoin price could be due for more losses if it breaks below the support of this symmetrical triangle pattern. Bitcoin Price Key Highlights. Bitcoin price recently formed higher lows and lower highs, creating a symmetrical triangle formation on the 1-hour time frame. Price appears ready to make a downside break, perhaps indicating that further losses are in the cards. The short-term consolidation pattern looks like a bearish flag when viewed from the longer-term time frames. Technical Indicators Signals. The 100 SMA is above the 200 SMA for now so the path of least resistance may be to....
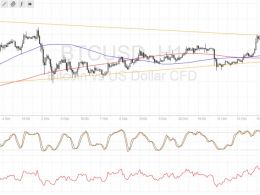
Bitcoin price faked out to the top and bottom of the symmetrical triangle formation as traders are positioning for major events. Bitcoin Price Key Highlights. Bitcoin price seems to be back inside its triangle consolidation pattern after a burst of volatility recently. Price broke to the upside of the triangle then snapped right back down to the bottom and is now moving sideways again. Traders could be bracing for bigger market catalysts ahead before pushing BTCUSD in a particular direction. Technical Indicators Signals. The 100 SMA crossed above the longer-term 200 SMA on this time frame....


