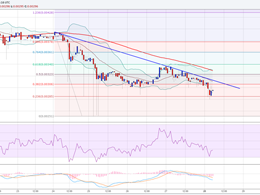
Ethereum Price Technical Analysis – ETH Buyers Be Careful
Ethereum price looks like setting up for a minor downside move. A break and close below the 100 hourly SMA may ignite a reaction. Ethereum Price – Move towards $9.00 possible? Ethereum price ETH corrected in two waves recently after making a minor top near $10.44. It moved down on a couple of occasions, but the 100 hourly simple moving average managed to prevent a downside move. However, the current price action suggests that there is a chance of ETH breaking the 100 hourly SMA in the short term. There was a bullish trend line formed on the hourly chart (data feed via Kraken) of ETH/USD,....
Related News
Key Highlights. Dash price managed to clear an important bearish trend line as highlighted in yesterday's analysis. The price remains below a major barrier of 0.0116BTC, which might ignite a move lower. More losses are favored as long as sellers defend the mentioned barrier. Recent break in the Dash price is a positive sign, but buyers need to be careful as the job is only half done. 0.0116BTC as a Hurdle. There was a break noted for the Dash price, as a bearish trend line as highlighted in yesterday's analysis was pierced by buyers. The price climbed higher after the break, but the upside....
Ethereum Price Key Highlights. Ethereum price is slowly trending higher on its 1-hour chart, after having completed a pullback bounce and resuming its trend. Price is moving inside a short-term rising channel and is currently testing the resistance near the 0.00300 major psychological mark. Ethereum price could be due for a selloff back to the channel support before the ongoing climb resumes. Buyers Need a Break. Technical indicators seem to be suggesting that the recent rally is overdone, with stochastic already turning down from the overbought zone and indicating a return in bearish....
Ethereum Price Key Highlights. Ethereum price moved down further and traded below the last week's low to set a new low of 0.00251BTC. There is a bearish trend line formed on the hourly chart, acting as a hurdle for buyers in the short term. There is a risk of more losses, as sellers look in control of the situation. Ethereum price continued to weaken as the price fell to a new low of 0.00251BTC where buyers appeared. Can Sellers Remain in Control? There was a lot bearish pressure noted on the Ethereum price recently, which took the price towards 0.00250BTC. There were a couple of nasty....
Key Highlights. Dogecoin price failed again to break an important resistance level at 38.0-40.0 Satoshis, which has become a concern for buyers. A bearish trend line on the hourly chart along with the 100 hourly moving average continue to act as a hurdle for more gains. Looking at the data feed from CEX. IO, there is a contracting triangle pattern formed, which is set for a break in the near term. Dogecoin price struggle continues, but sellers need to be very careful moving ahead as if there is a break, then sharp gains are likely. How Long Sellers Can Defend Upside? There was an attempt....
Key Highlights. Dash price continued to decline and traded lower to create a new low below yesterday's low of 0.0107BTC. There is a lot of bearish pressure, which means the chances of more losses are increasing. If the price moves above 0.0109BTC, then there is a possibility of a short-term recovery. Dash price continuous decline is a warning sign, which means buyers have to be careful moving ahead. Importance of 0.0109BTC. There was a downside reaction Intraday, which took the price to a new low of 0.0104BTC. Now, there is a possibility that buyers might attempt to take the price higher,....


