Bitcoin Price Technical Analysis for 05/09/2016 – Bulls Making a Comeback?
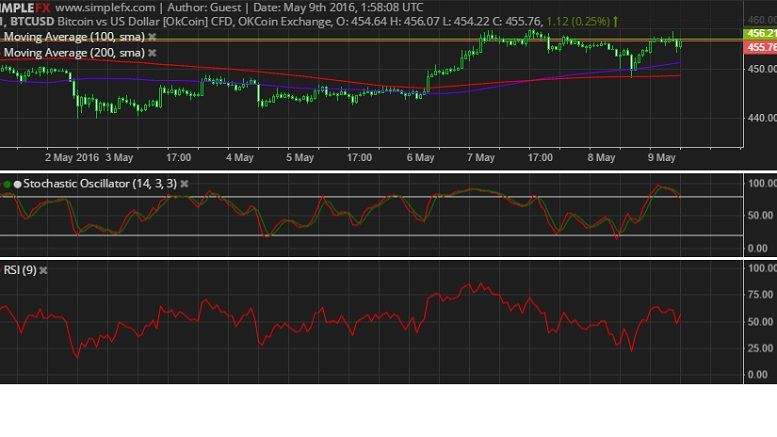
Bitcoin price found support at a broken resistance level but indicators suggest that sellers still have a chance. The 100 SMA is above the longer-term 200 SMA so the path of least resistance is to the upside and the rally could carry on up to $470 or higher. In addition, the 200 SMA held as dynamic support in the past so it might continue to keep losses in check from here. However, stochastic is indicating overbought conditions and is turning lower so bitcoin price could follow suit. This could take price down to the near-term support at $450 once more or until $440. Stronger selling....
Related News
Bitcoin price is retreating upon reaching its yearly highs but bulls could be ready for another push higher after this pullback. Bitcoin Price Key Highlights. Bitcoin price reached the yearly highs around $780 and profit-taking happened as predicted in the previous article. Price is now making a pullback from its recent rally and could encounter more bulls who are waiting at the next area of interest. Technical indicators are confirming that the uptrend could resume once the correction is completed. Technical Indicators Signals. The 100 SMA just crossed above the longer-term 200 SMA to....
Bitcoin price is bracing itself for a strong finish for the year, as it raked in more gains above $900. Bitcoin Price Key Highlights. Bitcoin price carried on with its climb as expected, after breaking past the $800 barrier a few days back. Price topped near $950 before making a pullback on Christmas Day, which then offered bulls a chance to add to their long positions or draw more buyers in. Price could be on its way to breaking past the recent highs from here. Technical Indicators Signals. The 100 SMA is above the longer-term 200 SMA on the 4-hour time frame of bitcoin, confirming that....
Bitcoin price rose 2 percent to cross the $270-mark. I discussed in my previous Bitcoin price analysis titled Time to buy some that the cryptocurrency could stage a small comeback rally as technical factors played out. Bitcoin price touched an intraday high of $271.50 and is now trading at $270.22. Technical analysis of the daily BTC-USD price chart states that market participants should exit their long trades if the price were to rise further to $275-277. Bitcoin Chart Structure - The support of the descending triangle will now act as the resistance for Bitcoin. The downward sloping....
Bitcoin price is safely inside its ascending channel on the 4-hour time frame and is making a run for the resistance again. Bitcoin Price Key Highlights. Bitcoin price gained further upside traction upon bouncing off the ascending channel support highlighted in earlier articles. Price is now making its way towards the top of the channel near the $780 highs or onto the $800 handle. Technical indicators are confirming that bulls are still in control of bitcoin action. Technical Indicators Signals. The 100 SMA is above the longer-term 200 SMA still, which means that the path of least....
The XRP price is showing signs of a strong comeback, according to a new technical analysis by TradingView crypto analyst ‘The Signalyst.’ The cryptocurrency is trading within a rising channel and quickly approaching a key support zone—a setup that indicates that bulls may be preparing for a higher leg up. XRP Price Gets Back In […]


