Ethereum Price Technical Analysis – Buy Target Hit, Now What?
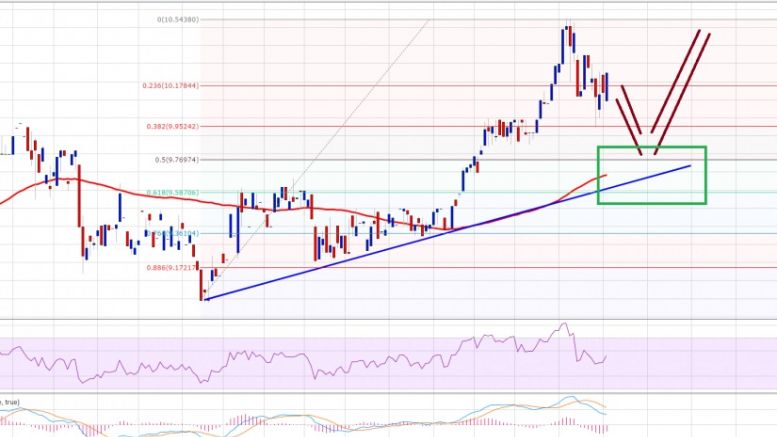
Ethereum price traded further higher yesterday, and reached my final target of $10.40. Now can it correct and trade higher once again? Key Highlights. Ethereum price continued to move higher vs the US Dollar and reached my final target of $10.40. There is now a bullish trend line formed on the hourly chart (data feed via Kraken) of ETH/USD, which may act as a support if the price moves down. The price has already started correcting lower, and it would be interesting to see how far it can go. Ethereum Price Trend Line Support. Ethereum price ETH after settling above the $10.00 resistance....
Related News

Bitcoin rises more than 2 percent to $430.21, nearing our year-end target of $440. In the previous price technical analysis A No Trade Market, we mentioned that an increasing MFI often causes price appreciation, and we are witnessing just that. The question now is: Would bitcoin be able to extend the gains or will it retrace its steps? Let us try to predict this with the help of technical analysis conducted on the 240-minute BTC-USD price chart. Bitcoin is well poised to increase its duration inside the $400-440 range, at least for the next couple of sessions. There is a high probability....
Ethereum price tumbled recently, and traded towards $8.00. It was a perfect sell, and it looks like the bulls may be exhausted. Ethereum price ETH was down and out, as there was a sharp downside move towards the $8.00 support area. I mentioned in my previous analysis that there is a chance of a decline in ETH/USD due to the technical indicators. It was a perfect sell, and the final target of $8.0 was achieved. There was a bearish trend line on the hourly chart (data feed via Kraken) of ETH/USD, which acted as a perfect catalyst for a decline. The price traded below $8.0, and a new low of....

Bitcoin briefly topped $250 for the first time since August 19, 2015, hitting a fresh monthly high of $250.09. We concluded the previous Bitcoin price technical analysis Retreats From Monthly Highs on a positive note saying that market participants should not be concerned about the drop and instead go long in Bitcoin near $242 for a target of $250. As can be seen, Bitcoin hit an intraday low of $242.82 before meeting the said target. Bitcoin is currently trading at $248.81, up 1.92 percent. And yes, we stand by our long call! bitcoin price chart. Below are the latest technical....

The Christmas isn’t turning out to be merry for Bitcoin. The cryptocurrency is struggling near the overhead resistance of $465. It is now trading 1.28% lower at $450.89, raising concerns that the market participants might pull out their funds in the holiday season. As a result, several technical indicators are also showing declines. We advised in the previous Bitcoin price technical analysis Target Achieved that traders should book at least partial profits in their long positions. And for today’s analysis, we will again be using the 4-h BTC-USD price chart from BITSTAMP.

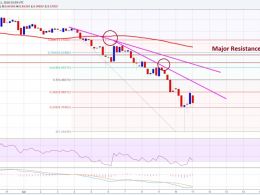
Ethereum has dropped 1.5 percent to 0.00197BTC, in line with our bearish expectations. We iterated our short view in the previous technical analysis titled Bitcoin-fueled bounce fades away. The price action in the past 24 hours has been strongly bearish and threatens a further 4% drop in the pair. Chart Structure – The underlying weakness in ETH-XBT forced the pair below the 20 4-h SMA (we discussed this possibility in the previous price analysis). The bulls did attempt to reverse the losses but failed miserably as the bears used the breached moving average as an offloading level. The pair....