Ethereum Price Technical Analysis – ETH Bulls Watch This
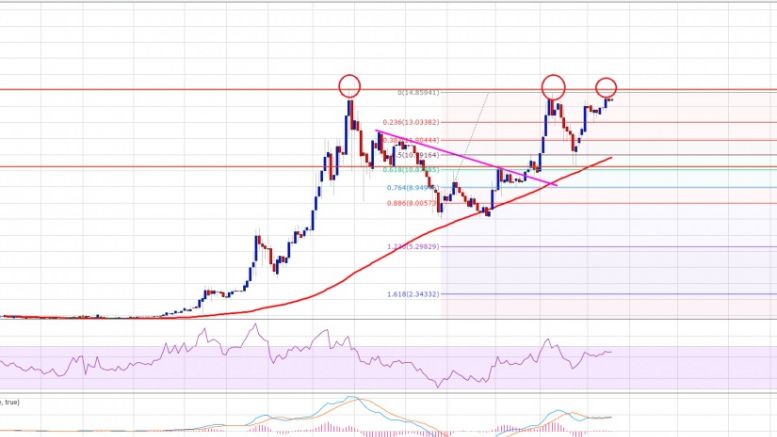
Ethereum price is trading near a major confluence resistance area of $15.00. Let us see how we can trade ETH/USD in the current situation. Key Highlights. Ethereum price stayed elevated against the US Dollar, but I think one should trade carefully moving ahead. There is a monster resistance area formed near $15.00, which acted as a barrier on many occasions. There is likely a Triple top pattern forming on the daily chart (data feed via Kraken) of ETH/USD, which if valid might call for losses. Ethereum Price Triple Top? Ethereum price ETH for the third time trading near the $15.00....
Related News

Ethereum price seems to have its sights set higher after breaking out of a descending triangle on its 4-hour chart. Technical indicators are also supporting further gains. Ethereum price had previously consolidated inside a descending triangle pattern, forming lower highs and finding support at 0.00250. At the moment, ethereum price is testing the near-term resistance at the 0.00300 level, waiting for more bulls for another leg higher. An upside break past this level could take it up to the next area of interest at 0.00330-0.00350 then onwards to the larger triangle highs at 0.00400.

Bitcoin is seeing a tepid start to this week as neither the bulls nor the bears exert any pressure on the other. The cryptocurrency looks relatively calm in the low-volume season, as do the technical indicators. Market participants should refrain from excessive trading in such conditions. Bitcoin is currently trading at $421.53. The technical indicators overlaid on the 4-h BTC-USD price chart from BITSTAMP are giving mixed signals. This, coupled with the lackluster price action, is compelling me to advise that this is a no-trade market, and one should wait for better opportunities to....

Ethereum Price Key Highlights. Ethereum price has been on a downtrend on its longer-term time frames, but it looks like the tides could turn. A double bottom pattern is visible on the 4-hour chart and price is making its way up to test the neckline at 0.0040. Ethereum price could be in for a long-term uptrend if it is able to break past the neckline resistance soon. Technical Indicators In Favor Of the Bulls. The technical indicators on the 4-hour time frame support further gains in ethereum price, as the 100 SMA just crossed above the 200 SMA. This signals that the path of least....
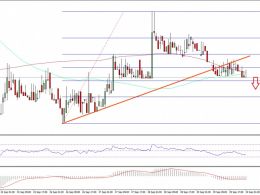
Ethereum price was trading above a short-term support versus the US Dollar until sellers appeared and took ETH/USD lower. Key Highlights. ETH price after failing to retain the bullish bias against the US Dollar failed and moved down. Yesterday’s highlighted bullish trend line on the hourly chart (data feed via SimpleFX) of ETH/USD was cleared by sellers during the recent downside. ETH bulls must trade carefully, as there is a chance of a downside move in the short term. Ethereum Price Downside Move. Ethereum price looks like made a short-term top near $13.21 against the US Dollar. There....

Ethereum has finally crossed over the downward sloping resistance line, albeit on a low volume, which fails to induce any confidence in the breakout. As can be seen from the 2-hour ETH-XBT price chart taken from Kraken exchange, there is no visible surge in volume reading even after the resistance has been taken out. A major contribution in ETH/XBT price rise is the sudden collapse in Bitcoin price. A free falling Bitcoin will aid this pair. Ethereum is currently trading at 0.00240BTC. The technical picture suggests that Ethereum will face significant selling pressure 0.00283BTC even if....