Ethereum Price Technical Analysis – Last Low Held Again
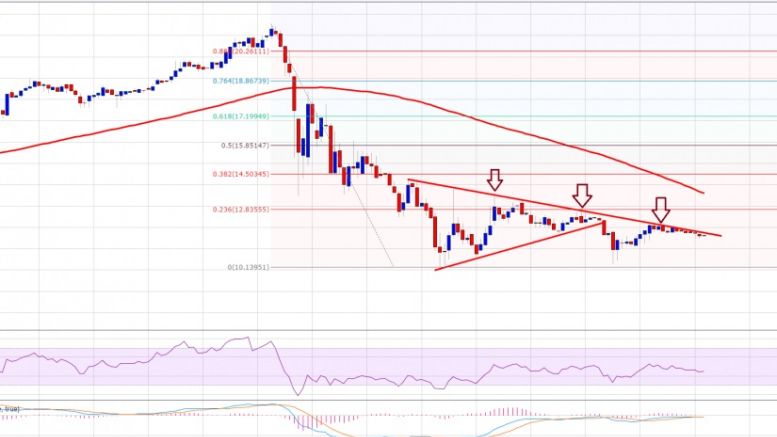
Ethereum price is fighting hard, but it won’t be an easy task for the ETH bulls. Only a break and close above $13.00 may call for a bullish move. Key Highlights. Ethereum price traded down one more time against the US Dollar, but the last low of $10.13 acted as a perfect support area. Yesterday’s highlighted contracting triangle pattern on the hourly chart (data feed via Kraken) of ETH/USD was broken during the downside move. The price is still below the upper trend line, which needs to be broken before the price can move higher. Ethereum Price Resistance. Ethereum price ETH traded lower....
Related News

Bitcoin price could be ready to resume its climb now that this area of interest held as support. Bitcoin Price Technical Analysis. Bitcoin price recently made an upside breakout from a near-term resistance around $660. Price has found resistance at the $670 area and has since pulled back to the broken resistance, which appears to have held as support. This signals that bitcoin bulls could be ready to charge once more, although technical indicators are suggesting otherwise. Technical Indicators Signals. The 100 SMA is still below the longer-term 200 SMA so the path of least resistance is to....

Ethereum Price Key Highlights. Ethereum price has been trending higher on its 1-hour time frame, cruising inside an ascending channel connecting the latest highs and lows of price action since last week. Price made its way to the top of the channel and resistance at the 0.00300 mark held as expected, putting it on track toward the support around 0.00270. Ethereum price could be due for a bounce off the channel support since this is in line with the ongoing uptrend. Bullish Divergence Seen. Technical indicators are also hinting at a return in buying pressure, as stochastic is already moving....

Ethereum Price Key Highlights. Ethereum price just finished testing the downtrend line resistance visible on the 1-hour chart and is starting to gain additional momentum heading back south. The 50% Fibonacci retracement level held as resistance on the pullback, putting ethereum price back on track towards the previous lows at 0.00156BTC. Ethereum price is resuming its impulse wave on the ongoing downtrend, possibly gearing up to test the previous lows or establish new ones. New lows in sight? Technical indicators are reflecting a return in bearish pressure, which suggests that sellers....

Ethereum is trading very flat in a dull session as bitcoin remains undecided about the future direction. Currently at 0.00191BTC, Ethereum is in a no trade zone as discussed in the previous technical analysis. Sole Positive – The technical indicators are, however, rebounding from the respective oversold levels. I would like to discuss the resistance and support levels for Ethereum now. To serve this purpose, I will be using the 4-h ETH-XBT pair. Chart Structure – The pair has been registering lower tops and lower bottoms for the past 10 trading sessions. Connecting the two highs in this....

Ethereum price has broken its last year $22 record. What is the reason for such a powerful surge? ETH/USD. What caused the price surge. There are several reasons for the price rally. They arise from the technical analysis and news. One of the major volatility factors is the conference that took place in Sydney, on March 7-9. The event was devoted to the current problems and future opportunities in the crypto industry. As for the technical part of the price rally, Ethereum price has stopped at a key resistance of the $20 point. At that mark, there are key lines ending the entire trend from....