Ethereum Price Weekly Analysis – 100 SMA Holds Key
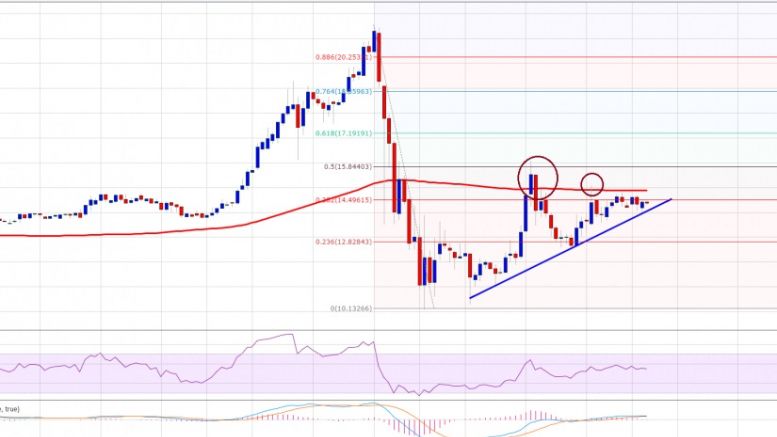
Ethereum price slowly and steadily moved higher this past week, and if it breaks 100 SMA (H4 chart), then more gains are likely. Key Highlights. Ethereum price traded with a positive tone this past week versus the US Dollar, and moved above the $14.00 resistance area. There is a bullish trend line formed on the 4-hours chart (data feed via Kraken) of ETH/USD, which is acting as a support area. The price is currently trading below the 100 simple moving average (H4), which holds the key for the next break in ETH. Ethereum Price Rise. Ethereum price ETH managed to gain bids this past week and....
Related News

The price of Ethereum (ETH) showed so much strength but has been hit with resistance against Tether (USDT) as the Ethereum merge is announced. Ethereum price rallied with so much strength from a region of $1,670 to $1,924, as bulls anticipate the Ethereum merge from proof-of-work (POW) to proof-of-stake (POS). Related Reading: Will Ethereum Breach $2,000 Before The Merge? Ethereum merge is an upgrade on the Ethereum network from POW to POS so as to increase its network efficiency in transactions. (Data feeds from Binance) Ethereum Price Analysis On The Weekly Chart From the chart, the....
The price of Ethereum (ETH) has struggled to hold above $2,000 against Tether (USDT) after being rejected from that region. Ethereum price in the past few weeks outperformed the price of Bitcoin (BTC) but has shown bearish signs indicating the ETH price could be set to retest the nearest support. Related Reading: TA: Ethereum Could Take Hit As The Bulls Show Weak Hands Ethereum (ETH) Price Analysis On The Weekly Chart From the chart, the price of ETH saw a weekly low of $1,700, which bounced from that area and rallied to a price of $2,030 after showing great recovery signs in recent....
The price of Polygon (MATIC) has shown great strength in the past few weeks against Tether as it maintained its bullish sentiment. Despite the retracement across the crypto market, Polygon has shown great strength holding above $0.75 compared to other crypto assets that have lost their key support. (Data from Binance) Related Reading: Majority Of Ethereum Investors Maintain Profitability Despite Decline Below $1,700 Polygon (MATIC) Price Analysis On The Weekly Chart From the chart, the price of MATIC saw its weekly low at $0.75; the price of MATIC bounced from that region to a price of $1....
The price of the Shiba Inu (SHIB) could be set for a major run as it holds its support against Tether (USDT). Bitcoin’s (BTC) price saw a bounce from $23,000 to $24,800 as the favorable news from the consumer price Index (CPI) saw a good response across the boards in the crypto market as the price of Shiba Inu eyes $0.00001700. Related Reading: AVAX Holds Steady And Sets Sights On $50 Barrier Breach The consumer price Index measures inflation in the economy, due to market sentiments this affects the prices of assets. (Data feeds from Binance) Shiba Inu Price Analysis On The Weekly....
The price of Ethereum (ETH) has struggled to break out of a range against Tether (USDT) after being rejected from key resistance. Ethereum price has seen a relief bounce, with Bitcoin (BTC) rallying after closing the weekly candle with bullish sentiment from a daily low of $23,000 to a region of $24,100 in the early hours. (Data feeds from Binance) Related Reading: TA: Bitcoin Price Could Rally If There Is A Close Above This Key Resistance Price Analysis Of ETH On The Weekly Chart Ethereum’s price saw a weekly close of around $1,720, with a new candle opening bullish ahead of the....