Bitcoin Price Technical Analysis for 06/28/2016 – Ascending Triangle Formation
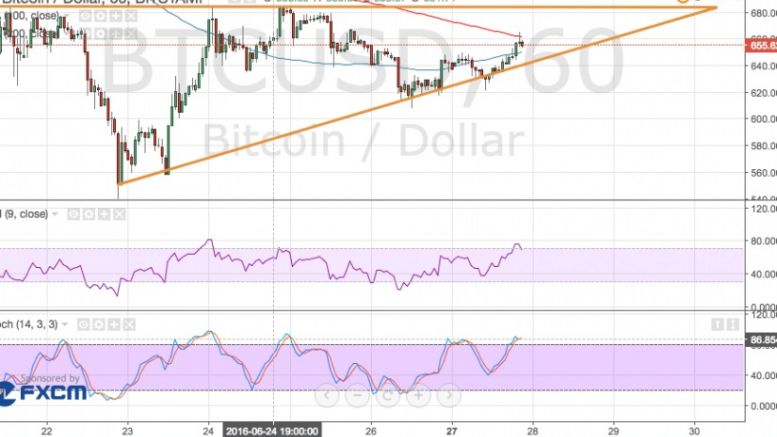
Bitcoin price is consolidating in an ascending triangle pattern while market participants wait for more catalysts. Bitcoin Price Key Highlights. Bitcoin price is back in consolidation after making strong moves in the past few weeks. Price has formed higher lows and found resistance around $680, creating an ascending triangle pattern. Bitcoin has just bounced off the triangle support and appears ready for another test of resistance. Technical Indicators Signals. The 100 SMA is below the 200 SMA so the path of least resistance is to the downside. However, the gap between the two moving....
Related News

Solana is currently breaking above an Ascending Triangle that could set a target of around $300, according to a cryptocurrency analyst. Solana Is Breaking Out Of An Ascending Triangle In a new post on X, analyst Ali Martinez has discussed about a triangle technical analysis (TA) pattern forming in the 12-hour price of Solana. The pattern in question is an “Ascending Triangle,” which appears whenever an asset’s price consolidates between two converging trendlines. Related Reading: Solana Social Media Hype Hits 11-Week High As Price Jumps 16% The special feature of the....
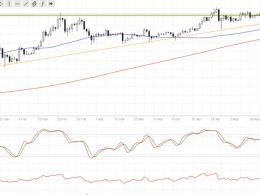
Bitcoin price is still inside its long-term triangle consolidation pattern and might make another test of the resistance. Bitcoin Price Key Highlights. Bitcoin price has formed higher lows and found resistance at the $470 level, creating an ascending triangle pattern on its daily chart. Price just bounced off the triangle support and is due for a test of resistance once more. Technical indicators are signaling that further gains are possible. Technical Indicators Signals. The 100 SMA is above the 200 SMA so the path of least resistance is still to the upside. A sharp move lower could find....

The Dogecoin price chart hints at a potential ascending triangle pattern formation, which could propel its price to new levels. In an X (formerly Twitter) post, a crypto analyst revealed that if the popular meme coin succeeds in creating this bullish technical pattern, it could trigger a price surge to $0.56. Dogecoin Price Eyes $0.5 […]
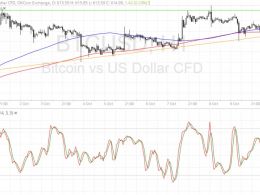
Bitcoin price is trading inside a symmetrical triangle consolidation pattern and might be ready for a breakout. Bitcoin Price Key Highlights. Bitcoin price has formed higher lows and found resistance at the $616 level, creating an ascending triangle pattern on the 1-hour time frame. Price is currently testing the resistance and could be due for a breakout sooner or later. Technical indicators are giving mixed signals on where bitcoin price could go next. Technical Indicators Signals. The 100 SMA is above the 200 SMA so the path of least resistance is to the upside. The chart pattern is....
The Bitcoin price has shown good signs of recovery over the past few days, briefly returning above the $85,000 level to kickstart the weekend. While BTC’s price has often floundered towards the end of the week in 2025, the premier cryptocurrency would be hoping to have a different journey over the next few days. Is $90,000 The Next Stop For Bitcoin Price? Fortunately, the future seems bright for the world’s largest cryptocurrency after crypto analyst Ali Martinez took to the X platform to share an exciting bullish prognosis for the Bitcoin price. According to the trader, the price of BTC....