Bitcoin Price Breaks Above Resistance
Bitcoin price followed a gold price move that broke above resistance today. The move, in both charts, comes as a surprise and we have to adjust our outlook. Bitcoin price has pushed above a constraining trendline, and this event invalidates the expectation that price was building a base for advance. Interesting to note that the gold price surged above long-term support (at $1,150) just prior to the bitcoin price chart trendline breach. Gold price is annotated in pale blue in the chart above (taken a few minutes prior to the bitcoin price surge) The wave up is reverse diverged to January....
Related News
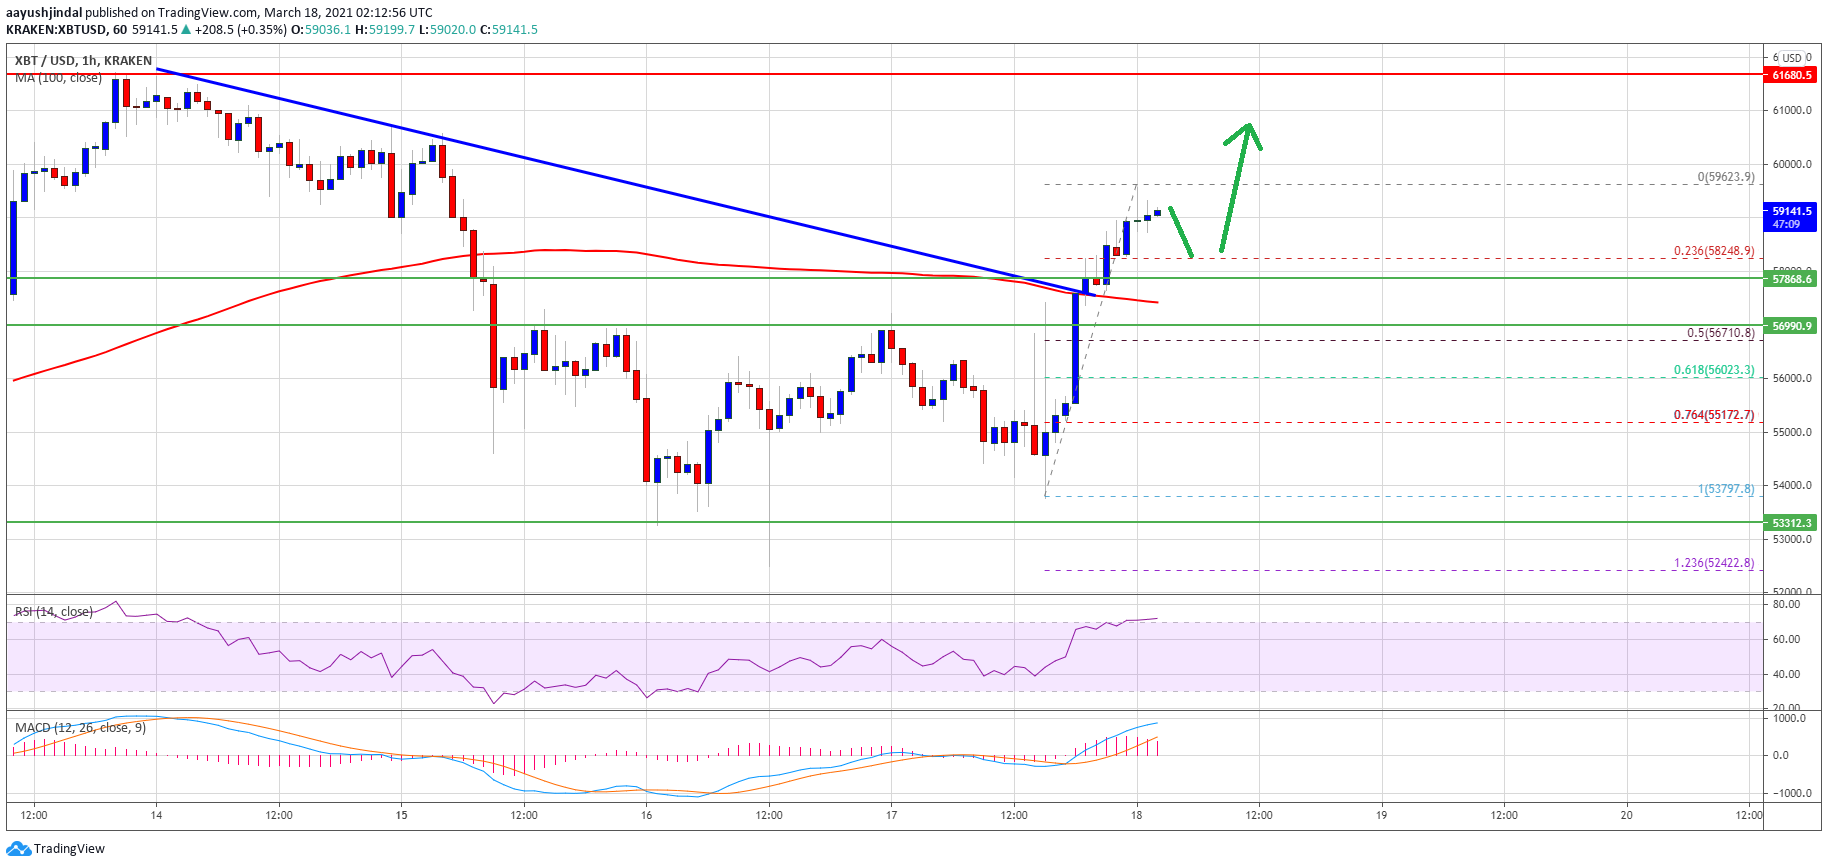
Bitcoin price gained bullish momentum above the $57,000 resistance against the US Dollar. BTC is now trading nicely above $58,000 and it is likely to continue higher. Bitcoin is up over 5% and it broke the key $58,000 resistance level. The price is now well above the $58,000 resistance and the 100 hourly simple moving […]
After experiencing months of slow action, the Cardano price is now flashing major bullish signals as it approaches a critical breakout level. Citing historical patterns and recent chart formations, a crypto analyst predicts that Cardano could rally by a staggering 300% if it successfully breaks through key resistance levels. Cardano Price Poised For 300% Rally […]
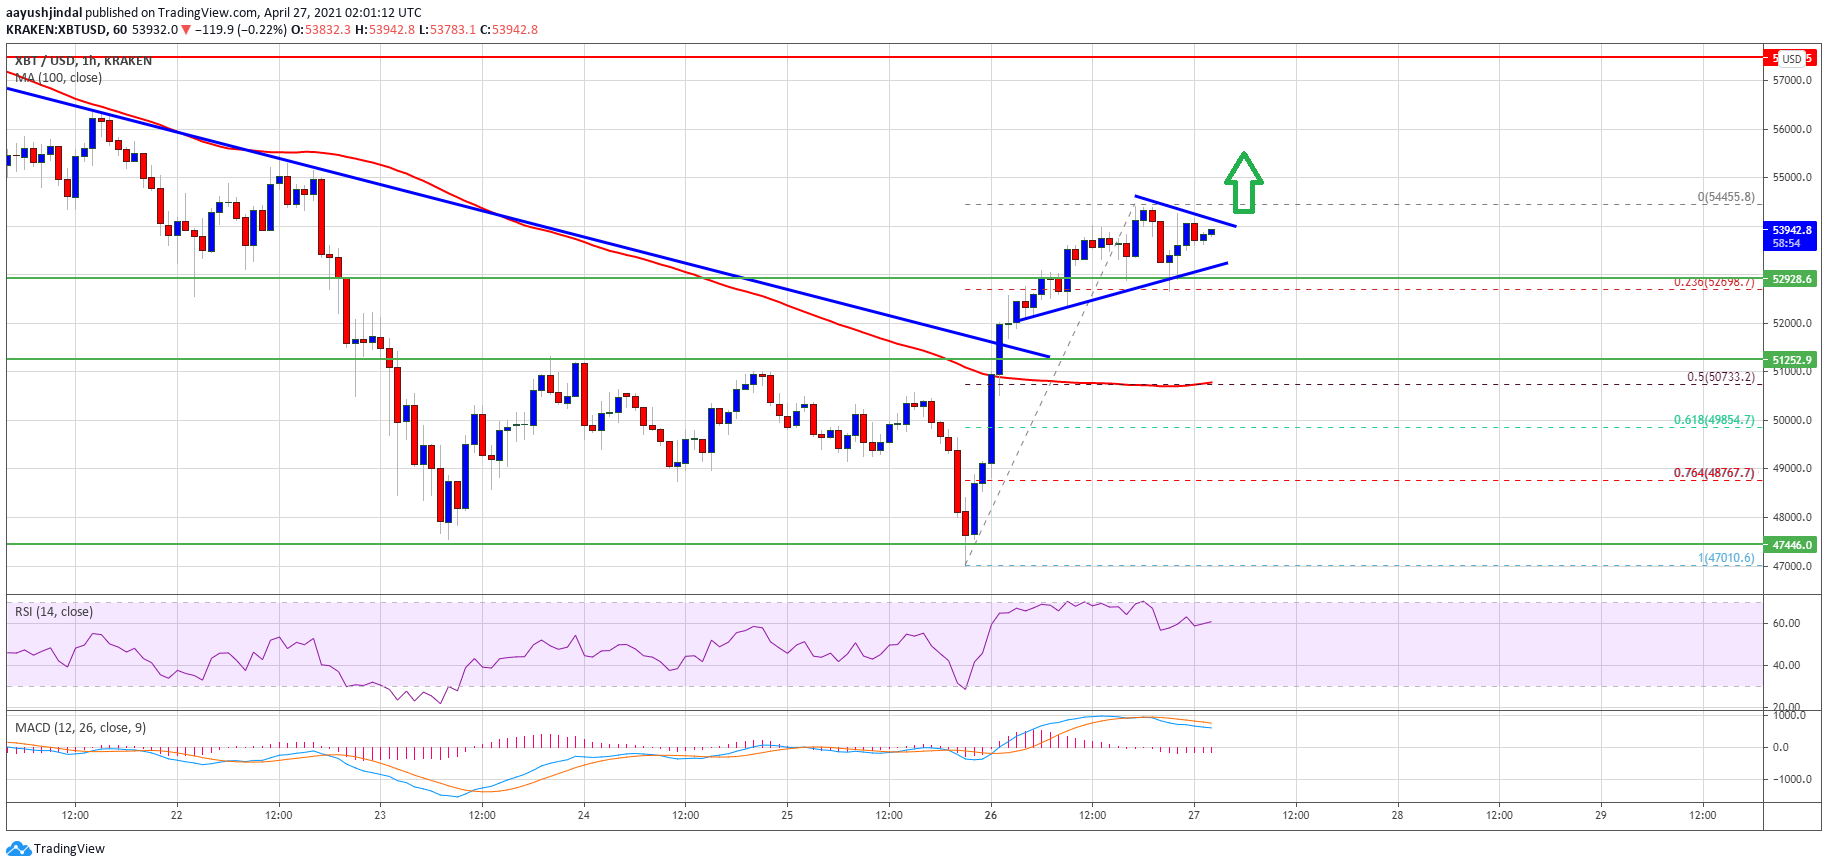
Bitcoin price gained pace and it cleared the $53,000 resistance zone against the US Dollar. BTC is consolidating and it seems ready for more gains above $54,000. Bitcoin remained well bid and it was able to clear the $53,000 resistance. The price is now trading well above $52,000 and the 100 hourly simple moving average. […]
Ethereum saw a massive rally today that has allowed its price to firmly break above $600, which has long been a resistance level Following the break above this resistance, the cryptocurrency rallied as high as $630 before its rally got overextended and resulted in it retracing down towards $615 It is recovering from this pullback, but the price just above where it is currently trading at may persist as a strong resistance level in the […]
The Dogecoin price looks set to witness a breakout above the psychological $1 level, having broken a resistance trendline. Crypto analyst Trader Tardigrade provided a timeline for when this massive surge could happen as DOGE rallies to a new all-time high (ATH). Dogecoin Price Eyes Rally Above $1 Following Breach Of Resistance Trendline In an […]


