Bitcoin Price Weekly Analysis – BTC/USD Sighting More Gains?
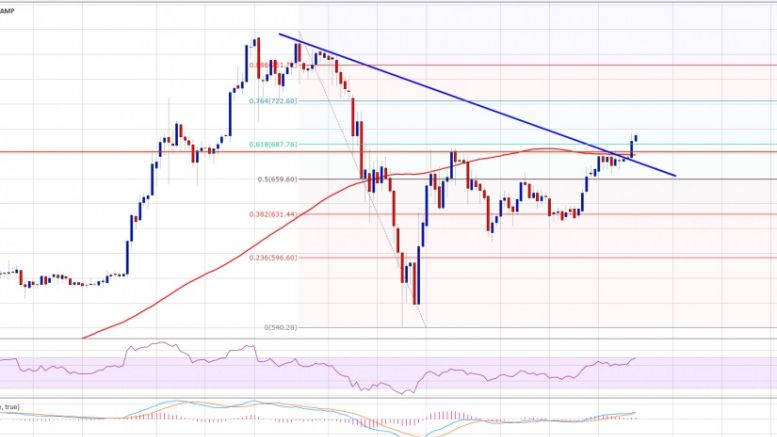
Bitcoin price recently moved above a major resistance area, and if the current break is true, there are chances of more upsides in BTC/USD. Key Points. Bitcoin price managed to climb higher this past week against the US Dollar, and looks set for more gains. There was a bearish trend line break noted on the on the 4-hours chart (data feed from Bitstamp) of BTC/USD, which is a positive sign. The price also moved above the 100 simple moving average on the 4-hours chart during the upside move. Bitcoin Price Break. Bitcoin price started to move higher this past week against the US Dollar and....
Related News
Bitcoin price made a nice move versus the US dollar, and stayed above $900. More gains are possible in BTC/USD in the near term? Key Points. Bitcoin price managed to stay above the $900 support against the US Dollar, which is a positive sign. There is a major breakout pattern formed on the 4-hours chart (data feed from SimpleFX) of BTC/USD with resistance near $930. A break and close above the triangle resistance might open the doors for more gains towards $950. Bitcoin Price Breakout Approaching. There were no major swing moves in Bitcoin price this past week against the US Dollar, as....
The price of Elrond (EGLD) has shown little relief bounce against Tether as it continues to range in its bearish flag pattern. Although relief bounces are shown by other cryptocurrencies across the market, with some double-digit gains, Elrond’s price has struggled to crack those gains. (Data from Binance) Related Reading: TA: Ethereum Loses Steam, Why 100 SMA Is The Key For More Gains Elrond Price Analysis On The Weekly Chart From the chart, the price of Elrond saw its weekly bottom at $40, and the price of EGLD bounced from that region to a price of $57 on the weekly chart as the....
The price of LoopRing (LRC) has shown no sign of relief bounce against Tether as it continues to range in its low region. Despite relief bounces shown by other cryptocurrencies across the market, some producing double-digit gains, LoopRing price continued to look dormant. (Data from Binance) Related Reading: ANKR Gained 12% In The Last 24 Hours. What’s Pushing It? LoopRing Price Analysis On The Weekly Chart From the chart, the price of LRC saw its weekly bottom at $0.35; the price of LRC bounced from that region to a price of $0.4 on the weekly chart as the price is unable to show much....
Bitcoin price spiked higher recently against the US Dollar, and registered a new weekly high to fulfil our last week’s target. More gains likely? Key Points. Bitcoin price surged higher further this past week versus the US Dollar, as forecasted in the last week analysis. There was a bearish trend line formed on the 4-hours chart (data feed from SimpleFX) of BTC/USD, which was broken to open the doors for more gains. The price traded as high as $675, and currently correcting lower. Bitcoin Price Rally. In the last weekly analysis, I mentioned that there is a chance of Bitcoin price moving....
Despite showing great recovery signs from a low of $0.33 with over 80% gains in weeks, Matic price faces strong resistance at $1. July has been good for most crypto projects, with the price of Matic surging to over 80% gains in just one month, although Matic price faces steep resistance at the $1 mark. Matic Weekly Chart Analysis The price of Matic moved from the low of $0.33 to a high of $1 before seeing a rejection to a region of $0.80. Matic saw a relief bounce when it met its all-time high (ATH) of 2021; this became a good support for Matic to build more buy pressure for a good relief....


