
Bitcoin Price Decline Bounces From $465
Bitcoin price slammed through several layers of support to hit a previous long-term resistance level at $465. Although the market seems to have found a bottom, there is not yet any technical reason to believe the decline is complete. Now is the time to count your money and sit out of the market for a few days or weeks. The 4-hour and 1-day timeframe charts gave us MA sell signals, and the 3-day chart gave us MACD and stochastic bearish signals. During the overlap of the late US trading session and early Asia-Pacific sessions, bitcoin price was sold to the resistance-turned-support level at....
Related News
So last night we published our twice-daily bitcoin price and highlighted what we will be looking at throughout the Asian session during Thursday evening. The main topic of conversation was the overarching bearish decline we have seen the bitcoin price over the last few days, and the suggestion that - if we broke in term support - this decline could well continue as we head into the weekend. As it happens, we did get a bit further decline, but during pre-session Friday morning, we have had a little bit of reprieve. So, with this said, what of levels that we are keeping an eye on in the....

Dogecoin has rebounded strongly after hitting a crucial support level, reinforcing bullish expectations laid out in a recent technical analysis. The popular meme cryptocurrency, which suffered a sharp decline last week, has defied concerns of an extended decline by bouncing off the $0.16896 reversal zone and now climbing toward higher levels. Now trading at $0.22, […]

Darkcoin digs deeper into the red as the price slips from 0.0158BTC to 0.01473BTC in the past 24 hours. Previous lows were violated with the price plummeting to a new low of 0.0143BTC amid the selling pressure. Bulls are caving in to the pessimism and the cryptocurrency may see further downside in the absence of any positive trigger. Upon implementation of the technical analysis on the 240-minute DRK/BTC price chart, it can be concluded that the bearish momentum will only intensify from here on. However, the price decline may not be abrupt but could rather be steady. Chart Structure - Ever....

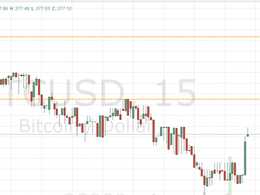
Bitcoin price picked itself up from the dusty valley floor today. Although it’s looked more healthy, it appears nothing is broken. Since yesterday’s low we’ve had 5 waves up. The advance has stopped at 15-minute 200MA (not shown) and is currently trailing the hour 20MA (green). At label 5 the advance is accompanied by reverse divergence in RSI. In other words, RSI is indicating a high exceeding previous highs that price is nowhere near reaching. Hence, the current downward correction. Bitcoin price advanced strongly from yesterday’s low, but the market now seems indecisive. It is....
The foremost meme coins, Dogecoin (DOGE) and Shiba Inu (SHIB) have failed to show any sign of life following the recent market decline. These crypto tokens have traded sideways despite other altcoins enjoying relief bounces. Why Dogecoin And Shiba Inu Continue To Trade Sideways Dogecoin and Shiba Inu are believed to have maintained unimpressive price […]