
Technical Analysis: Weekend Bitcoin Price Slump Not Stopping Bulls
Don’t be alarmed by the current slump in the bitcoin price. In fact, there is still cause for optimism. The market is going through a reversal pattern to the $700 level, where a congestion area should reinforce quotes for another climb to $820, keeping us right on track to hit the projections advanced last week. Bitcoin Price Analysis: Bulls Still in Control. Long-Term Analysis. After testing the lowest support at the $580-$600 level, prices should enter an upward reversal pattern soon, which will allow an initial pull back to $700, extended to Fibonacci´s technical objective at $820. The....
Related News

As mentioned in the previous Bitcoin price technical analysis, Afloat, But For How Long?, the remarkable work done by the bulls to defend their crucial weekly support of $220-225 has finally paid off during this weekend as Bitcoin price surged 5.29 percent to $241.01. During the latest price move, Bitcoin also crossed a near-term resistance which had kept it subdued for several sessions. But let us now discuss the price targets, the supports and the resistances. Bitcoin Chart Structure - Since August 19th, Bitcoin had been trading with its upside capped near $235 (we discussed this....

In my Friday's analysis post, Drops, But Still Near Highs!, I had mentioned that bulls were challenging a key resistance level of $1.865 and may eventually take the price higher to north of $2.000. But, they were overwhelmed by the strong selling pressure over the weekend and Litecoin's moments of glory came to an abrupt end! As bears hammered bulls, Litecoin lost 9.82% over the weekend to trade at $1.670. The 240-minute LTC/USD price chart reveals that the cryptocurrency is now considerably near the crucial support zone, below which we may witness a flash crash. Litecoin Chart Structure -....

The weekend brought pain for Bitcoin, but that was always on the cards. My Friday's Bitcoin price technical analysis Palpable Strain concluded on a bearish note saying that a close below $286 could bring in further decline, and as can be seen, the cryptocurrency did slump intraday to $276.57 before taking support from near the previous consolidation level of $275. Bitcoin is currently trading at $281.26. Now, the important question that must concern the trading community is: Is this relief from the support level for real or is it a trap? This analysis will aim to provide some answers.....

I do not have any positives to lay out for the bulls, neither regarding the weekend action nor regarding the future price expectation. I had advised in Crashes 20% Intraday that any rally up to the resistance level of $4.100 should be used to go short in the counter. During the weekend, the price did enter the bears' mansion and has been sliding since then. Currently, Litecoin is trading at $3.678, down 1.34% from Friday's observation. Litecoin looks weak from the purview of technical indicators as well. Find below the technical considerations of the daily LTC-USD price chart. Litecoin....
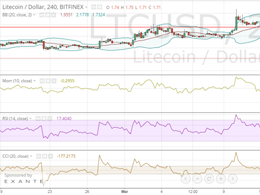
In yesterday's Litecoin analysis titled, Pressure Mounts, I discussed the possibility of the altcoin heading lower and recommended shorting. In the last 24 hours, bulls have been decimated as the value dived from $1.97 to a six-week low of $1.60. However, the price recovered to $1.71 as sellers booked partial profits. The crash in Litecoin price came in conjunction with an absolute slump in the Bitcoin price from $280 to $250. Bitcoin has routinely had a prominent effect on other cryptocurrencies. Technical analysis on the 240-minute LTC/USD indicates that the sentiment has turned strongly....