
Bitcoin Price At The Final Slump?
Bitcoin price continues slumping as the smaller timeframe chart indicators continue to swing wildly. The chart signals are mixed. The 1hr chart’s indicators have become meaningless as the range of price narrows during apparent ongoing consolidation. The 1hr chart is, therefore, not anything to go by. At the 4hr timeframe (above) we’ve just had a series of five advancing waves fall away from yesterday’s high. Price is still below the 4hr 200MA (at the red arrow) and the 4hr stochastics (top, blue circle) are falling away from their maximum. A low will, conceivably, only be struck when the....
Related News

Bitcoin price is pushing higher once again but the market is struggling to make a new high since last week. Could this be the final push to resistance? The exchanges saw a bout of increased buying between 12h00 and 15h00 UTC when the bulls pulled price out of its ongoing two-day slump. At the time of writing the push has not produced a new high (since last week) in any of the exchange charts – with the exception of a nominal new high in the BTCC chart. The upside level to conquer is at $470 (Bitstamp) and 3000 CNY, shown in red in the 1-hour chart. Establishing trade above this long-term....
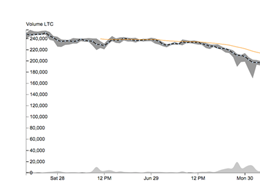
Litecoin is experiencing its biggest price slump ever. When the altcoin went mainstream, litecoin closely followed bitcoin's sometimes extreme price swings, peaking at $40 in late 2013, soon after bitcoin passed the $1,000 mark. However, in less than two months, litecoin has lost that close relationship with its golden sibling, prompting community members and some industry leaders to question litecoin's viability. Barry Silbert, Founder and CEO of SecondMarket, recently posted the following tweet raising the issue: Litecoin price appears to be decoupling from bitcoin. Money rotating out of....

Crypto analyst CasiTrades has indicated that the XRP price could drop to a final low before it begins its next leg to the upside. In line with this, she highlighted the target to watch out for as altcoin looks to end this downtrend and begin its recovery. Level To Watch As XRP Price Eyes Final […]
Bitcoin price remains nearly 10% below recent highs, as the major cryptocurrency continues its slump after early last week’s sell off. Since hitting a new all-time high of $61k, BTC has continued to face downward pressure, hovering around the $54,000 price level. The past week’s volatility has resulted in bulls losing nearly $2.6 billion in liquidations, according to ByBt. Understanding Bitcoin’s Recent Price Action There were two major catalysts that led to last week’s sizable […]
The Dogecoin price has successfully completed its final retest of a crucial support level, signaling renewed potential for a significant rebound. According to crypto analyst Trader Tardigrade, Dogecoin could be headed to new all-time highs, as historical chart patterns suggest a parabolic surge might be on the horizon. Dogecoin Price Concludes Final Support Retest In […]