Ethereum Price Technical Analysis – Annoying Range Trading
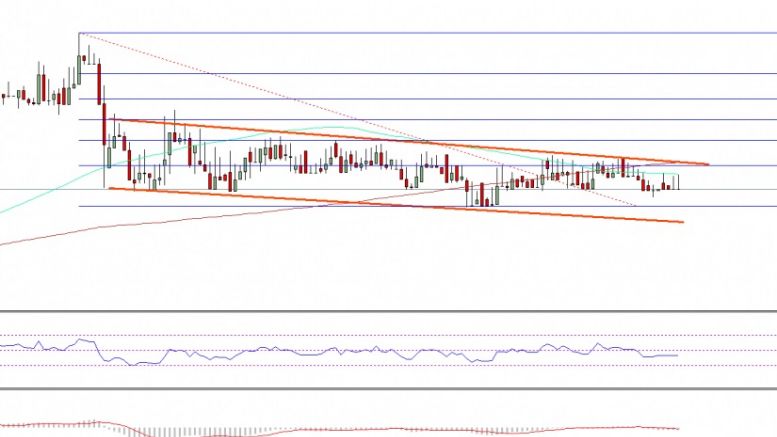
Ethereum price failed to gain momentum, and remained in a range. Let us see what may happen next and whether there can be any more or not. Key Highlights. ETH price remained in a small range against the US Dollar, which is now annoying for investors. There is a channel pattern formed on the hourly chart (data feed via SimpleFX) of ETH/USD, which may provide us a few moves in the near term. A break above $11.60 is needed for the next move in the ETH/USD pair. Ethereum Price Breakout Pattern. Ethereum price declined a few points yesterday against the US Dollar, as the ETH bulls failed to....
Related News
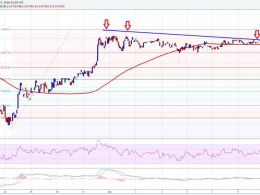
Ethereum price is still in wait and watch mode. No doubt, there is a major break forming on the hourly chart, which traders must consider before trading. Key Highlights. Ethereum price continued to trade in a very tiny range vs the US Dollar, as there was no real move in ETH/USD. Yesterday’s highlighted bearish trend line on the hourly chart (data feed via Kraken) of ETH/USD is still intact and acting as a resistance for the buyers. On the downside, the 100 hourly simple moving average is acting as a support and preventing losses. Ethereum Price Break. Ethereum price ETH may be annoying to....
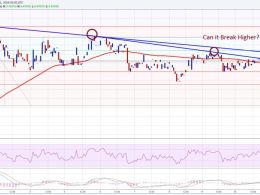
Ethereum price after dipping a few points towards $9.20 found support. It looks like ETH/USD is struggling to gain pace in the short term. Ethereum price ETH showed no signs of bullish moves, and continued to trade in a tiny range. It looks like the ETH bulls are not able to find a solid reason to take the price higher. We can say that ETH/USD is currently directionless and it may continue to trade in a range in the short term. There are a couple of bearish trend lines formed on the hourly chart (data feed via Kraken) of ETH/USD, which may ignite moves. The price just moved above the 100....
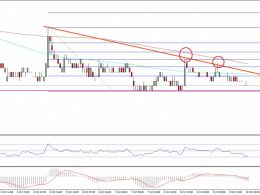
Ethereum classic price did not gain much against the Bitcoin, and also failed to decline. It looks like the ETC/BTC pair remains lifeless for now. Key Highlights. Ethereum classic price did not move much during the past two days against the US Dollar. There was a push below the 0.00182BTC support, but the price found bids near 0.00180BTC. There is a new small bearish trend line formed on the hourly chart of ETC/BTC (data feed via Simplefx), which is currently preventing an upside move. Ethereum Classic Price Resistance. Ethereum classic price continued to annoy traders, as there was hardly....

Litecoin fell more than 5 percent over the weekend as weakness returned to haunt the cryptocurrency markets. The Bitcoin market is also struggling to cope with the selling pressure and has returned to its crucial support of $220. Litecoin is currently trading at $3.330 and is well within its medium term trading range. In the previous Litecoin price technical analysis Sell on Rallies, we discussed how Litecoin remains weak and any rise in the valuation can be used to go short. That holds valid for even today. The latest technical indicators are nowhere positive or indicate that a reversal....

Litecoin has broken out from the two-week trading range we discussed in the previous Litecoin price technical analysis titled Range Trading? as positivity from the Bitcoin market spills over. Litecoin is currently trading at $2.887. Though a breakout may seem as the best indication for the market participants to go long on Litecoin, my advice would be to wait for a close above $2.950 or buy on a dip. But, why do I say this? Read on the technical indications below to find out. I still find the technical indications fairly mixed and therefore, require stronger signals or a low-risk....