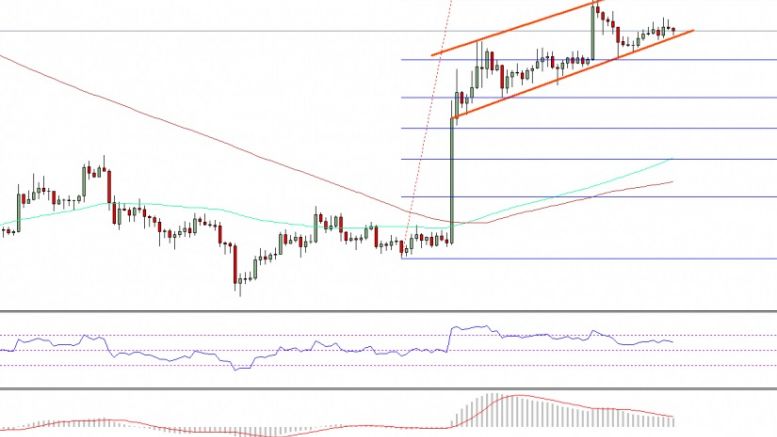
Bitcoin Price Weekly Analysis –BTC/USD Remain In Uptrend
Bitcoin price remained in an uptrend this past week versus the US Dollar, and my view of further gains played well in the near term. Key Points. Bitcoin price continued to surge higher this past week against the US Dollar and traded above $620. There is an ascending channel pattern formed on the 4-hours chart (data feed from SimpleFX) of BTC/USD, which is acting as a support area. As long as the price is in the channel, there is a chance of more gains in the near term. Bitcoin Price Rise. Bitcoin price consolidated for some time against the US Dollar before climbing higher. In the last....
Related News

Ethereum ETH price regained its bullish trend against Tether (USDT) as it builds more strength to break above the key resistance ahead of “The Merge.” ETH price saw a rejection to a region of $1,500 recently as it could not hold its bullish trendline acting as support. (Data from Binance) Related Reading: Shiba Inu Burn Events Spark A Rally In Altcoin Over The Past Weeks Ethereum ETH Price Analysis On The Weekly Chart From the chart, the price of ETH saw its price rejected to a region of $1,540 on the weekly chart as the price was unable to hold $1,700 and the trendline acting....

Bitcoin price has been consolidating in a range between $525 and $485 during the past week. Daily updates have highlighted the ambiguity of trend. Are we at the start of a new uptrend or is the decline still in force - just pausing before the dive? An infrequent technical event has manifested in the form of a moving average cross-over and, as discussed below, it provides us with a timely canary in the coal mine. New CCN Bitcoin Price Analysis Format. A new schedule for technical analysis reports has been adopted. A weekly in-depth report will be published every Sunday, and provide an....
ATOM price struggles on high timeframes to trend higher despite showing bullish sentiment in recent times. ATOM trades below uptrend support as the price looks bearish with the current market state. The price of ATOM eyes key support as price trades below 50 and 200-day EMA. The price of Cosmos (ATOM) struggles to discover its bullish trend as the price breaks below uptrend support against tether (USDT). The previous weeks saw the crypto market cap looking good as prices of Bitcoin (BTC) and other crypto assets, including Cosmos (ATOM), showed so much strength as price rallied from a low....

It's a rags-to-riches story for Tezos this week, while Bitcoin bulls fail to find momentum for a full recovery from Tuesday's major price dip. Bitcoin (BTC) ranged below a critical weekly close target on Sept. 10 as analysis warned its multi-week uptrend was in danger. BTC/USD 1-hour candle chart (Bitstamp). Source: TradingViewBTC price lags $1,500 below crucial levelData from Cointelegraph Markets Pro and TradingView showed BTC/USD trading at around $46,000 Friday after rejecting near $47,450 the day before.That level marks the lower bound of Bitcoin's uptrend on the weekly chart, one....
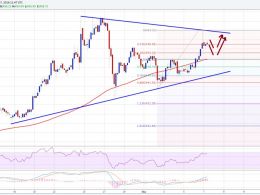
Bitcoin price as forecasted in the last weekly analysis started to trade higher. If the current sentiment stays, BTC/USD can test $470. Bitcoin Price- Buying dips? Bitcoin price climbed higher this past week and traded towards the $470 resistance area against the US Dollar. The best part of the upside move was the fact that the price settled above the 100 simple moving average on the 4-hours chart (data feed from Bitstamp) of BTC/USD. Once the price closed above the stated MA, there was a sharp rise towards $465 where it found offers. There is now a contracting triangle pattern formed on....