Bitcoin Price Technical Analysis for 09/14/2016 – Long-Term Climb Gaining Steam?
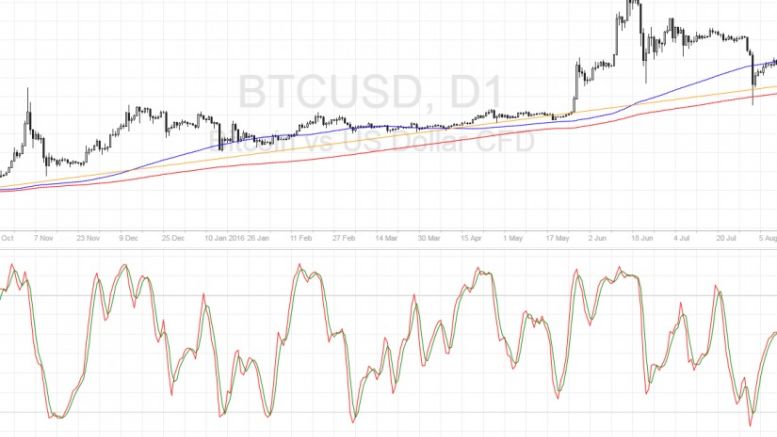
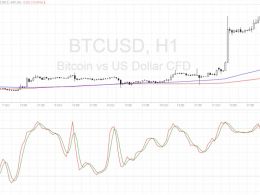
Bitcoin price is still hovering close to the long-term rising trend line but could be trying to resume its rally. Bitcoin Price Key Highlights. Bitcoin price has been trending higher on its longer-term time frames, moving above a rising trend line visible on the daily chart. Price recently tested the trend line support and made a bounce, which suggests that bulls are intent on keeping the uptrend intact. The rally is still finding legs but there are technical arguments for a continuation of the climb. Technical Indicators Signals. The 100 SMA is above the longer-term 200 SMA on this time....
Related News
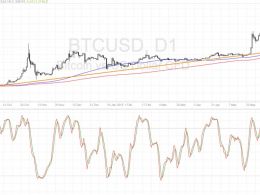
Bitcoin price is testing a long-term support area, with technical indicators hinting at a continuation of the climb. Bitcoin Price Key Highlights. Bitcoin price is in the middle of a sharp selloff but it seems to have found support at the rising trend line as predicted in the previous post. Price spiked off the $500 level, as plenty of buy orders were likely waiting in that area of interest, which held as resistance in the past. Technical indicators seem to be suggesting that the longer-term climb could resume from here. Technical Indicators Signals. The 100 SMA is above the longer-term....
Bitcoin price is once again testing the rising trend line support and might be due for another bounce to its previous highs and beyond. Bitcoin price already bounced off the 61.8% Fibonacci retracement level at $428.58 and appears ready to climb to the swing high at $447.94. However, buyers still seem hesitant and are still waiting for more bulls to join the fold. For now, price is stalling at the 50% Fib at $432.15 and might need another quick test of the trend line, which lines up with the 100 SMA. Speaking of the moving averages, the short-term 100 SMA is still above the longer-term 200....
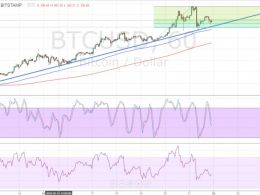
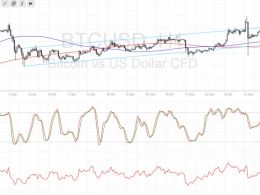
Bitcoin price is taking a bit of a break from its ascent, probably waiting for more bulls to join in. Bitcoin Price Key Highlights. Bitcoin price recently made a strong surge, but it appears that bulls are running out of steam. A larger correction might be needed in order to draw more buyers to the mix and allow the climb to resume. Price is stalling just below the latest highs near $940 and appears to be testing near-term support areas. Technical Indicators Signals. The 100 SMA is above the longer-term 200 SMA on the 1-hour chart, confirming that the path of least resistance is still to....
Bitcoin price is on a tear but is pausing in a bullish consolidation pattern before heading further north. Bitcoin Price Key Highlights. Bitcoin price recently established strong upside momentum after breaking above a short-term ascending channel. Price is consolidating from here as buyers are waiting for more bulls to join. An upside breakout or a major pullback could offer opportunities to hop in the ongoing climb. Technical Indicators Signals. The 100 SMA is above the longer-term 200 SMA so the path of least resistance is to the upside. In addition, the gap between the moving averages....
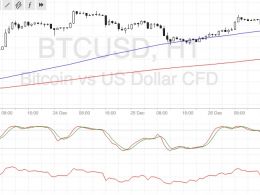
Bitcoin price has given way to dollar strength after the FOMC statement but could be ready to resume its climb. Bitcoin Price Key Highlights. Bitcoin price seems to be forming a new short-term rising channel visible on the 1-hour chart. Price was weighed down by dollar strength after the FOMC sounded more hawkish than expected in its latest statement. Bitcoin price still looks intent to carry on with its climb as technical indicators hint that a bounce is due. Technical Indicators Signals. The 100 SMA is above the longer-term 200 SMA so the path of least resistance is to the upside. In....