Bitcoin Price Technical Analysis for 09/20/2016 – Aiming for Next Support?
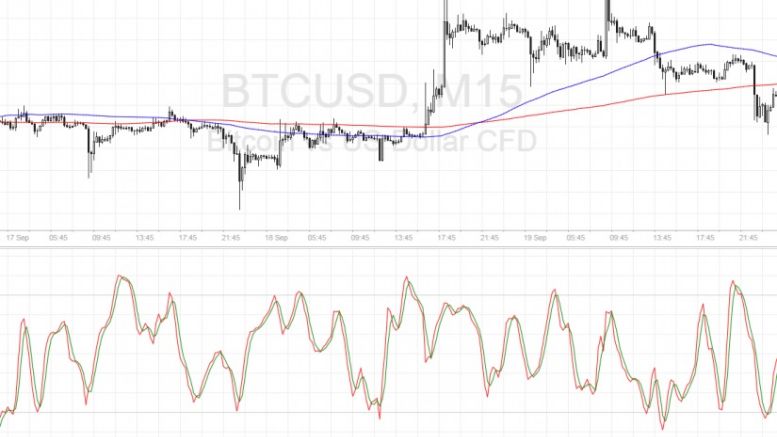
Bitcoin price might be aiming for a bounce off the nearby support zone, although a downside break is also possible. Bitcoin Price Key Highlights. Bitcoin price has been unable to establish a clear direction in the past few days as traders seem to be waiting for the top-tier catalysts. On the shorter-term time frames, it can be seen that bitcoin price seems to be heading close to the support at $605. A small reversal pattern can be seen so a bounce might be due but technical indicators are hinting otherwise. Technical Indicators Signals. The 100 SMA is crossing below the longer-term 200 SMA....
Related News
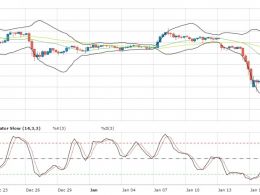
Bitcoin price seems poised for more declines, putting it on track towards testing a major support zone visible on the longer-term time frames. However, technical signals are looking mixed for now. At the moment, risk appetite appears to be waning once more, as the IMF recently decided to lower their global growth forecasts for 2016 and 2017. The institution highlighted the risks stemming from the slowdown in China and the slump in commodity prices, particularly to emerging economies. With that, the safe-haven US dollar is reigning supreme against most of its counterparts, particularly the....
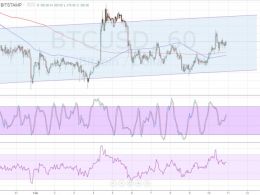
Bitcoin price could turn upon hitting the resistance at the top of the rising channel, possibly making its way towards support again. Technical indicators are giving mixed signals but it looks like the short-term uptrend might carry on. The 100 SMA is below the 200 SMA so the path of least resistance might be to the downside, signaling that the mid-channel area of interest could still keep gains in check. If so, bitcoin price could drop back to the channel support around $370-372. Stochastic is on the way up so there may be some buying pressure left enough to trigger a test of the....
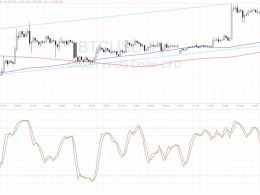
Bitcoin price could be due for a test of the channel support once more, with technical indicators confirming a potential bounce. Bitcoin Price Key Highlights. Bitcoin price is still inside its ascending channel pattern after getting rejected on its attempt to break past the resistance. Price could be headed for the channel support for another bounce higher. Technical indicators suggest that the uptrend could carry on. Technical Indicators Signals. The 100 SMA lines up with the channel support around $665, adding to its strength as a potential floor. In addition, the 100 SMA is safely above....
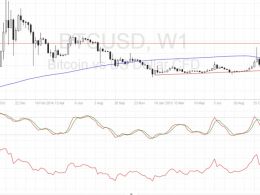
Bitcoin price made a strong upside breakout on Friday and could be in for a larger climb after a bit of correction. Bitcoin Price Key Highlights. Bitcoin price made a strong breakout from the $500 yearly highs, indicating its potential to keep the bullish run going. Zooming out to the longer-term weekly chart shows the next possible resistance levels. However, technical indicators are hinting that buyers are feeling exhausted and that a correction might be due. Technical Indicators Signals. The 100 SMA is above the longer-term 200 SMA on the weekly chart so the path of least resistance is....

Bitcoin remains at the same price level from last week, reinforcing the $600 support area for the entire new cycle. Meanwhile, technical analysis indicates that bullish consensus is getting stronger, increasing the likelihood of a rally from $650 to $820. 5th Elliott Wave forecasting, based on Fibonacci numbers, could be calculated to the technical objective around the $820 area, where several theories point to the delayed next stage. From there, a technical correction should send prices back to $700, giving stragglers a second chance to recalculate their strategies to join. After another....