Ethereum Price Technical Analysis – ETH Overbought, Caution Ahead
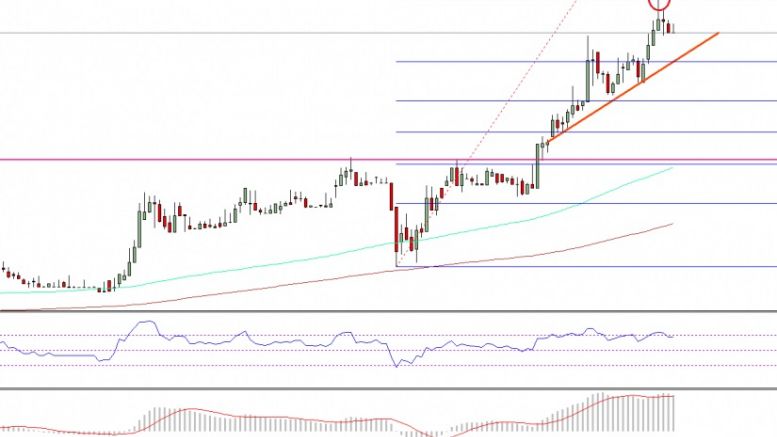
Ethereum price surge is impressive against the US Dollar, but the traders need to be careful now as there is a chance of a correction. Key Highlights. ETH price moved further higher against the US Dollar during the past 24 hours and created a new high. Yesterday’s highlighted bullish trend line on the hourly chart (data feed via SimpleFX) of ETH/USD acted as a perfect buy area and produced a bounce. The price is now in the overbought area, and may correct lower in the near term. Ethereum Price Surge. Ethereum price continued to impress, as it registered solid gains not only against the US....
Related News
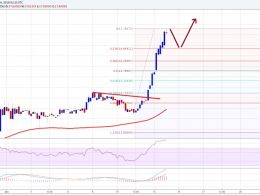
Ethereum price surge continued intraday vs the US Dollar. It looks like ETH/USD may be boosted further, but I suggest trading with caution. Key Highlights. Ethereum price showed no mercy to the sellers’ vs the US Dollar, as it continued to rocket higher. A new high was formed in ETH/USD, as the price surged above the $17.00 level. Looking at 4-hours chart (data feed via Kraken) of ETH/USD, the technical indicators are around overbought levels, which is a warning sign. Ethereum Price Overbought? Ethereum price ETH made a new high against the US dollar for the second time in a new this week,....
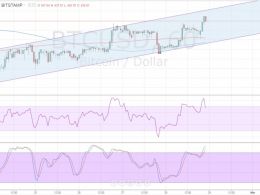
Ethereum Price Key Highlights. Ethereum price is slowly trending higher on its 1-hour chart, after having completed a pullback bounce and resuming its trend. Price is moving inside a short-term rising channel and is currently testing the resistance near the 0.00300 major psychological mark. Ethereum price could be due for a selloff back to the channel support before the ongoing climb resumes. Buyers Need a Break. Technical indicators seem to be suggesting that the recent rally is overdone, with stochastic already turning down from the overbought zone and indicating a return in bearish....
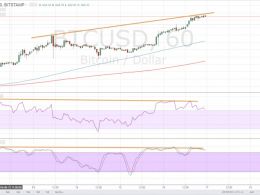
Bitcoin price could be due for a quick selloff at this point, as profit-taking might happen ahead of the weekend and next week’s EU referendum. Bitcoin Price Key Highlights. Bitcoin price has been on a tear these days but some technical indicators are hinting at an exhaustion. Price is closing in on the $800 level, which is an area of interest visible on longer-term time frames. If a selloff is seen at the current levels, it could find nearby support at $700. Technical Indicators Signals. The 100 SMA is above the 200 SMA for now so the path of least resistance is to the upside. In....
Ethereum Price Key Highlights. Ethereum price is still stuck inside its range, finding support at 0.00285 and resistance at 0.00305. Price bounced off the bottom of the range as expected and is on its way to test the top again. Ethereum price could keep moving sideways, especially if the top of the range holds as resistance and spurs another test of support. Buyers Regaining Control. Technical indicators are suggesting that a bounce is underway, with stochastic and RSI both climbing out of the oversold region to indicate a return in bullish momentum. The average directional index is moving....
Bitcoin price is gradually trading higher inside an ascending channel and might be due to test the resistance near $445. Technical indicators suggest that bitcoin price might bounce off the top of the range, as RSI is starting to turn down from the overbought zone. Stochastic still seems to be on the move up but has just landed in overbought territory, indicating that buying pressure might fade soon. In addition, the 100 SMA is below the 200 SMA, suggesting that the path of least resistance is to the downside. However, an upward crossover appears to be brewing, which could mean that the....


