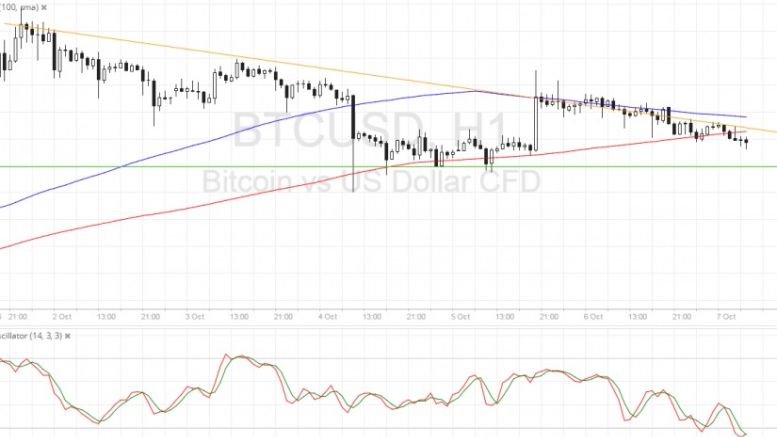
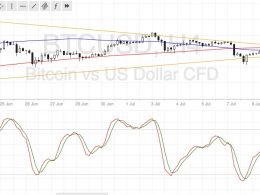
Bitcoin Price Technical Analysis for 10/07/2016 – Small Triangle Pattern
Bitcoin price is moving inside a tiny triangle consolidation pattern but may be due for a breakout sooner or later. Bitcoin Price Key Highlights. Bitcoin price has formed lower highs and found support around $607.50, creating a descending triangle visible on its short-term time frames. Price seems to have gotten rejected at the resistance and is on its way towards testing support once more. Technical indicators are suggesting that a bounce off the area of interest could be seen. Technical Indicators Signals. The 100 SMA is above the longer-term 200 SMA, which suggests that the path of....
Related News
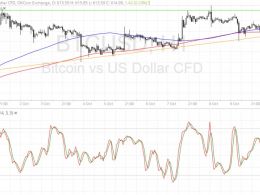
Bitcoin price is trading inside a symmetrical triangle consolidation pattern and might be ready for a breakout. Bitcoin Price Key Highlights. Bitcoin price has formed higher lows and found resistance at the $616 level, creating an ascending triangle pattern on the 1-hour time frame. Price is currently testing the resistance and could be due for a breakout sooner or later. Technical indicators are giving mixed signals on where bitcoin price could go next. Technical Indicators Signals. The 100 SMA is above the 200 SMA so the path of least resistance is to the upside. The chart pattern is....
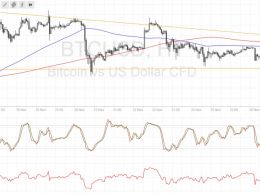
Bitcoin price is still stuck inside the triangle consolidation pattern but might be gearing up for a breakout soon. Bitcoin Price Key Highlights. Bitcoin price has formed lower highs and found support around $730, creating a descending triangle pattern. Price just bounced off support and might be ready for a test of resistance at $750-755. Technical indicators seem to be hinting that the resistance would hold, although a breakout is possible with this week’s event risks. Technical Indicators Signals. The 100 SMA is below the longer-term 200 SMA so the path of least resistance is still to....
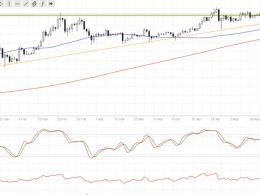
Bitcoin price is still inside its long-term triangle consolidation pattern and might make another test of the resistance. Bitcoin Price Key Highlights. Bitcoin price has formed higher lows and found resistance at the $470 level, creating an ascending triangle pattern on its daily chart. Price just bounced off the triangle support and is due for a test of resistance once more. Technical indicators are signaling that further gains are possible. Technical Indicators Signals. The 100 SMA is above the 200 SMA so the path of least resistance is still to the upside. A sharp move lower could find....
Bitcoin price could be due for a strong break out of its consolidation pattern, but traders still seem to be undecided which way to push. Bitcoin Price Technical Analysis. Bitcoin price is still stuck in its consolidation pattern visible on the 4-hour time frame. Price is already at the peak of the symmetrical triangle formation, which means that a breakout could take place anytime now. Technical indicators and market sentiment appear to be hinting at a downside break. Technical Indicators Signals. The 100 SMA is below the 200 SMA so the path of least resistance is to the downside. A....
Since the last Litecoin price technical analysis Will This Support Hold?, Litecoin has gained $0.067 or 2.45 percent to trade at $2.800. The better part is that Litecoin is currently in a short-term technical pattern which will lead to a big swing in the price. Read on below the latest technical considerations of the daily LTC-USD price chart. Litecoin Chart Structure - Upon a closer look at the price action of the past 6-7 sessions, it can be found that Litecoin has been trading in a small triangle. A triangle, which is a continuation pattern, in a downtrend implies that a bigger downmove....