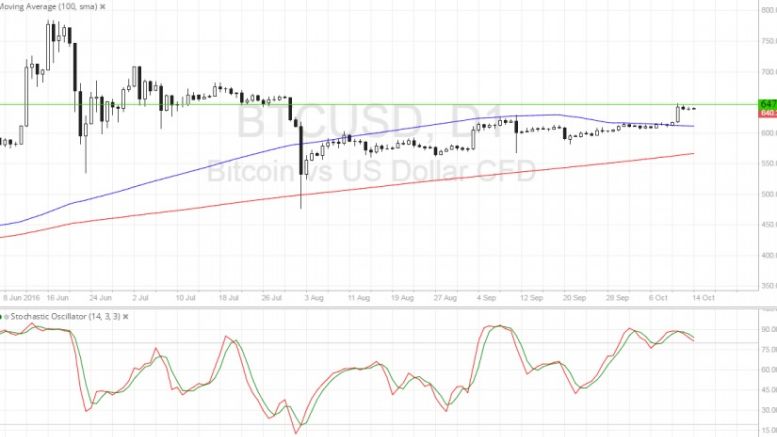
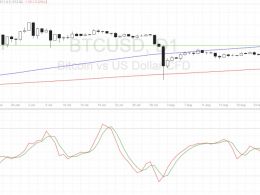
Bitcoin Price Technical Analysis for 10/14/2016 – Strong Area of Interest
Bitcoin price is stalling at a strong area of interest visible on the long-term charts, with indicators suggesting that the resistance could hold. Bitcoin Price Key Highlights. Bitcoin price is consolidating on its short-term time frames and for good reason. Price is actually testing a major area of interest at $645-650, as this held as support in the past and could keep holding as a ceiling. Technical indicators on the longer-term charts are giving mixed signals at the moment. Technical Indicators Signals. The 100 SMA is above the longer-term 200 SMA on the daily time frame, showing that....
Related News
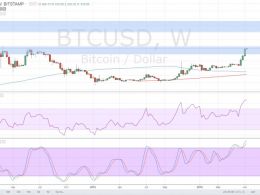
Bitcoin price has shown strong upside momentum over the past few weeks and might be eyeing a test of these next ceilings. Bitcoin Price Key Highlights. Bitcoin price made another break higher over the weekend, indicating strong bullish momentum. Price is now testing another long-term area of interest around $700, at which either profit-taking or another upside breakout might be seen. Technical indicators are hinting that the rallies could pause but it would be helpful to look at the next potential resistance levels. Technical Indicators Signals. The 100 SMA is above the 200 SMA for now so....
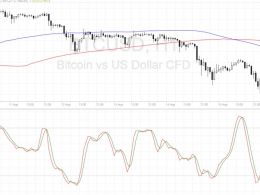
Bitcoin price enjoyed a strong rally recently but could be ready to resume its slide soon if this area of interest holds. Bitcoin Price Key Highlights. Bitcoin price broke above the neckline of the short-term double bottom formation illustrated in the previous article. Price has climbed to the $580 area since and is testing the support turned resistance level. Additional resistance is located around technical inflection points so a return in bearish pressure could be due. Technical Indicators Signals. The 100 SMA is below the longer-term 200 SMA, confirming that the path of least....
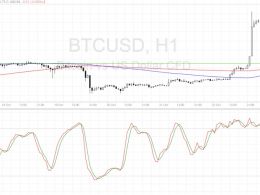
Bitcoin price could make a correction from its recent rally then resume the climb since bulls are waiting at the area of interest. Bitcoin Price Key Highlights. Bitcoin price recently broke past an area of interest around $642 then rallied to the $675 area. From there, price retreated and is showing signs of a potential pullback to the broken resistance. Technical indicators are showing that the climb could resume at some point. Technical Indicators Signals. The 100 SMA just crossed above the longer-term 200 SMA to show that the path of least resistance is to the upside and that the rally....

Bitcoin price could be ready to resume its climb now that this area of interest held as support. Bitcoin Price Technical Analysis. Bitcoin price recently made an upside breakout from a near-term resistance around $660. Price has found resistance at the $670 area and has since pulled back to the broken resistance, which appears to have held as support. This signals that bitcoin bulls could be ready to charge once more, although technical indicators are suggesting otherwise. Technical Indicators Signals. The 100 SMA is still below the longer-term 200 SMA so the path of least resistance is to....
Bitcoin price is having trouble breaking past this area of interest visible on the daily time frame as technical indicators are giving mixed signals. Bitcoin Price Key Highlights. Bitcoin price is still stuck in consolidation on its short-term time frames and looking at the daily chart shows why. Price is actually stalling below a former support zone around the $600-620 area, which might continue to hold as resistance. Price is also encountering a bit of a ceiling around its 100 SMA on the longer-term chart. Technical Indicators Signals. The 100 SMA is above the longer-term 200 SMA on this....