Ethereum Price Technical Analysis – ETH/USD Back In Action
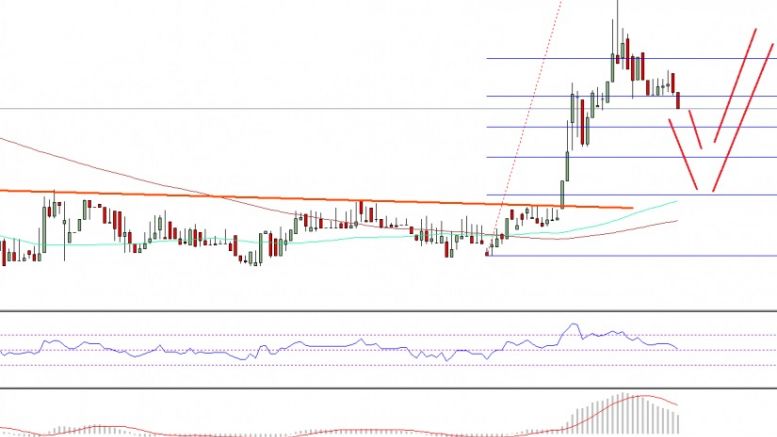
Ethereum price is back in action, as there was a nice upside move in ETH/USD. More gains are likely moving ahead as the resistance is now support. Key Highlights. ETH price surged higher versus the US Dollar and posted a solid move above the $12.00 handle. Yesterday’s highlighted bearish trend line on the hourly chart (data feed via SimpleFX) of ETH/USD was broken for an upside move. The ETH bulls managed to gain control, and took the price higher towards $12.75. Ethereum Price Bounce. Yesterday, I stated that the ETH buyers need an encouragement for an upside move. Ethereum price did move....
Related News

XRP is now back trading above $3 and is holding well above the price level. This is on the back of days of consolidating around $2.8. Although price action in the past 24 hours has seen XRP trading back above $3, it is yet to confirm a close to solidify the zone. Against this backdrop, technical analysis of the XRP 4-hour candlestick timeframe chart shows a critical level that could determine whether XRP finally breaks free into price discovery. Resistance Keeping XRP From Price Discovery Although the XRP price is currently inching slowly upwards, technical analysis shows it is yet to....
Ethereum has started to show signs of life again after weeks of muted price action, but one analyst believes the current move is only the beginning of something much larger. This inclination is based on a technical setup built around a hidden inefficiency zone after the Ethereum price recently broke above $4,500. The technical analysis shows that the unfilled gap may be the first waypoint in a recovery that eventually pushes the ETH price to five figures above $10,000. The FVG Zone Now Acting As A Magnet Technical analysis done by crypto analyst Crypto Patel laid out a path to where the....

The 1-day Bitcoin price chart is looking more bullish every week, yet there are some immediate technical influences at smaller timeframes that are affecting price. Technical analysis looks at a bearish influence in the 4-hour chart that is presently pushing price down. This analysis is provided by xbt.social with a 3 hour delay. Read the full analysis here. Not a member? Join now and receive a $29 discount using the code CCN29. Bitcoin Price Analysis. Time of analysis: 05h38 UTC. Bitstamp 4-Hour Chart. From the analysis pages of xbt.social, earlier today: Price Action. The lower high in....

Ethereum is trading very flat in a dull session as bitcoin remains undecided about the future direction. Currently at 0.00191BTC, Ethereum is in a no trade zone as discussed in the previous technical analysis. Sole Positive – The technical indicators are, however, rebounding from the respective oversold levels. I would like to discuss the resistance and support levels for Ethereum now. To serve this purpose, I will be using the 4-h ETH-XBT pair. Chart Structure – The pair has been registering lower tops and lower bottoms for the past 10 trading sessions. Connecting the two highs in this....

A crypto analyst, who publishes technical analysis to his audience on X, has released a zoomed-out weekly Ethereum chart that interprets the current price weakness as the final stage of a multi-year accumulation cycle. As it stands, the Ethereum price is trading around $2,100 and 57% below its peak. Therefore, the technical analysis is suggesting that […]