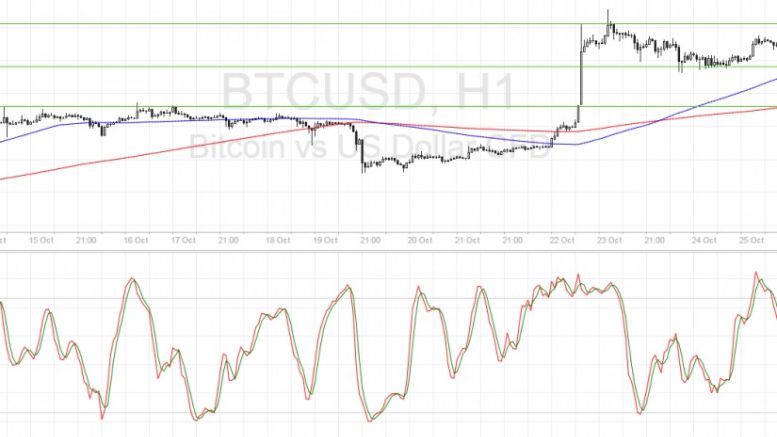
Bitcoin Price Technical Analysis for 10/26/2016 – Tossing and Turning in the Range
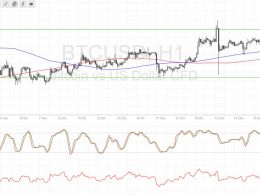
Bitcoin price had a volatile run but remains stuck inside its short-term range. Bitcoin Price Key Highlights. Bitcoin price volatility picked up recently but it was unable to bust out of its range. Both bulls and bears attempted for a breakout but the cryptocurrency is still trapped between support at $658 and resistance at $670. Technical indicators are suggesting that the longer-term climb could carry on and that another upside breakout attempt could take place. Technical Indicators Signals. The 100 SMA is still above the longer-term 200 SMA, which means that the path of least resistance....
Related News
Bitcoin price could continue to trade sideways as the Christmas holidays are approaching and volumes might be turned down. Bitcoin Price Key Highlights. Bitcoin price seems to be moving sideways recently, possibly establishing its range for the remainder of the year. Volatility has been subdued again after the FOMC statement led to a sharp rally for the dollar then a quick reversal. Bitcoin price found support around $765 and resistance at $795. Technical Indicators Signals. The 100 SMA is still above the longer-term 200 SMA so the path of least resistance is to the upside. Bitcoin price....
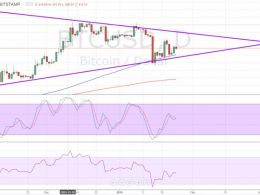
Bitcoin price just bounced off the bottom of its long-term symmetrical triangle on the daily time frame and might be due for a test of resistance. Any strong breakout in either direction for bitcoin price could set the tone for its longer-term trends for the rest of the year so keep close tabs on this triangle formation. Bitcoin price has been tossing and turning on the short-term time frames, as risk sentiment keeps shifting. On the longer-term chart such as the daily time frame, a consolidation pattern can be seen. Bitcoin price formed higher lows and lower highs since November last....
Bitcoin price is settling inside a range but technical indicators seem to be hinting at an upside breakout. Bitcoin Price Key Highlights. Bitcoin price has been moving sideways on the slowdown in volatility, stuck in a range between support at $575 and resistance at $590. Price appears to be bouncing off the top of the range once more, gearing up for another test of support. However, technical indicators are suggesting that a breakout could take place. Technical Indicators Signals. The 100 SMA is still above the longer-term 200 SMA on this time frame, signaling that the path of least....
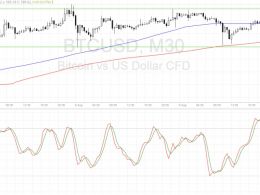
Bitcoin price could be due for another test of the short-term range support, with technical indicators supporting a bounce. Bitcoin Price Key Highlights. Bitcoin price has been treading carefully inside a tight range visible on its short-term charts. Price seems to have lost bullish momentum and is headed for the bottom of the range at $601.50. Technical indicators are hinting that losses could be kept in check. Technical Indicators Signals. The 100 SMA is above the longer-term 200 SMA on this time frame, hinting that the path of least resistance is still to the upside. In fact, bitcoin....
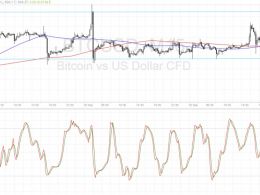
Bitcoin price is stuck in consolidation, stalling at the middle of its range and still deciding whether to make a test of resistance or not. Bitcoin Price Key Highlights. Bitcoin price has been moving sideways recently, bouncing off support at $565 and finding resistance at $585. Price is in the middle of its range for now and may be encountering a bit of resistance at the area of interest. A break above the moving averages could put it on track towards testing the range resistance once more. Technical Indicators Signals. The moving averages are oscillating, which suggests that the....

