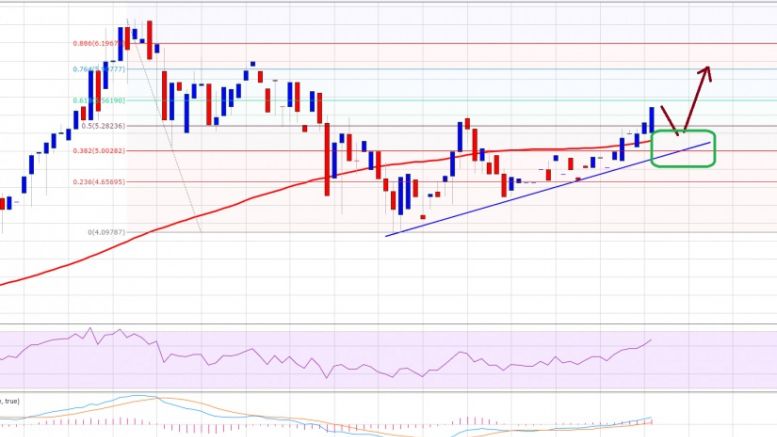
Ethereum Price Technical Analysis – Initial Target Hit, Now What?
Ethereum price moved higher and broke the $5.20 resistance area. Looking ahead, if buyers remain active more gains are likely. Intraday Support Level can be $5.20. Intraday Resistance Level may be $5.60. Ethereum price corrected this past week, but found support near the $4.00-10 area where buyers successfully defended any further losses. There was a bearish trend line formed on the hourly chart of Ethereum price (data feed via Kraken), which we were waiting to be breached to enter a long trade. The price did move higher and cleared the trend line to ignite an upside move. Our initial....
Related News

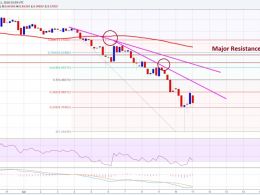
Key Highlights. Litecoin price broke a major support area on the hourly chart (price feed from Bitfinex) and traded lower. Our initial sell target of $3.10 was achieved as forecasted in the recent technical analysis post. The price may attempt to correct higher in the short term and might face sellers near $3.15-20. Litecoin price moved lower sharply and failed to trade higher, suggesting that buyers are struggling to hold the ground. Support Turned Resistance. Finally, our previously highlighted $3.40 resistance area acted as a catalyst and pushed Litecoin price lower. A major support....

Bitcoin rises more than 2 percent to $430.21, nearing our year-end target of $440. In the previous price technical analysis A No Trade Market, we mentioned that an increasing MFI often causes price appreciation, and we are witnessing just that. The question now is: Would bitcoin be able to extend the gains or will it retrace its steps? Let us try to predict this with the help of technical analysis conducted on the 240-minute BTC-USD price chart. Bitcoin is well poised to increase its duration inside the $400-440 range, at least for the next couple of sessions. There is a high probability....

Bitcoin price continued advance today in a strong surge that hit $360. At the time of writing price is drawing back as the market comes to terms with the day's price action. This analysis is provided by xbt.social with a 3-hour delay. Read the full analysis here. Not a member? Join now and receive a $29 discount using the code CCN29. Bitcoin Price Analysis. Time of analysis: 14h00 UTC. OKCoin 3Mth 1-Hour Chart. From the analysis pages of xbt.social, earlier today: Price pushed higher in a manner that is characteristic of strong advance. However, initial surges during advance are often....
Ethereum price tumbled recently, and traded towards $8.00. It was a perfect sell, and it looks like the bulls may be exhausted. Ethereum price ETH was down and out, as there was a sharp downside move towards the $8.00 support area. I mentioned in my previous analysis that there is a chance of a decline in ETH/USD due to the technical indicators. It was a perfect sell, and the final target of $8.0 was achieved. There was a bearish trend line on the hourly chart (data feed via Kraken) of ETH/USD, which acted as a perfect catalyst for a decline. The price traded below $8.0, and a new low of....

Bitcoin briefly topped $250 for the first time since August 19, 2015, hitting a fresh monthly high of $250.09. We concluded the previous Bitcoin price technical analysis Retreats From Monthly Highs on a positive note saying that market participants should not be concerned about the drop and instead go long in Bitcoin near $242 for a target of $250. As can be seen, Bitcoin hit an intraday low of $242.82 before meeting the said target. Bitcoin is currently trading at $248.81, up 1.92 percent. And yes, we stand by our long call! bitcoin price chart. Below are the latest technical....