Bitcoin Price Weekly Analysis – Can BTC/USD Test $800?
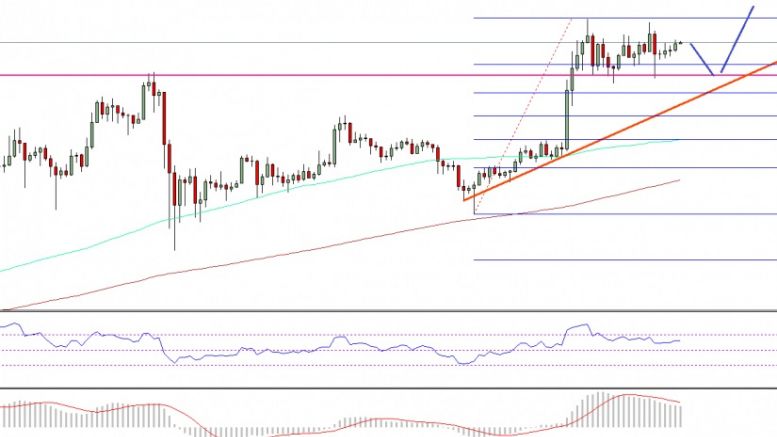
Bitcoin price continued to gain strength against the US Dollar, and it looks like BTC/USD remains a good buy if it dips or corrects lower. Key Points. Bitcoin price remained in an uptrend against the US Dollar, and traded above the $750 resistance. There is a major bullish trend line formed on the 4-hours chart (data feed from SimpleFX) of BTC/USD, acting as a support area. If the price corrects lower, it may find buyers near the $750-40 levels. Bitcoin Price Major Support and Buy Area. There were continuous gains in Bitcoin price against the US Dollar, as it broke a couple of important....
Related News
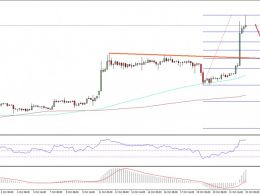
Bitcoin price spiked higher recently against the US Dollar, and registered a new weekly high to fulfil our last week’s target. More gains likely? Key Points. Bitcoin price surged higher further this past week versus the US Dollar, as forecasted in the last week analysis. There was a bearish trend line formed on the 4-hours chart (data feed from SimpleFX) of BTC/USD, which was broken to open the doors for more gains. The price traded as high as $675, and currently correcting lower. Bitcoin Price Rally. In the last weekly analysis, I mentioned that there is a chance of Bitcoin price moving....
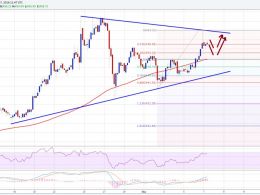
Bitcoin price as forecasted in the last weekly analysis started to trade higher. If the current sentiment stays, BTC/USD can test $470. Bitcoin Price- Buying dips? Bitcoin price climbed higher this past week and traded towards the $470 resistance area against the US Dollar. The best part of the upside move was the fact that the price settled above the 100 simple moving average on the 4-hours chart (data feed from Bitstamp) of BTC/USD. Once the price closed above the stated MA, there was a sharp rise towards $465 where it found offers. There is now a contracting triangle pattern formed on....

The price of Polkadot (DOT) shows strength after bouncing from key support on the weekly chart against Tether (USDT). After Bitcoin (BTC) bounced from its monthly low of $19,000, this signaled a relief for other crypto altcoins including the price of Polkadot. (Data feeds from Binance) Related Reading: SOL Loses $40 After The Exploit – What’s The Next Support? Price Analysis Of Polkadot On The Weekly (1W) Chart From the chart, the price of DOT saw a weekly low of around $6.50, where it has formed support. The price has built more momentum as it faces resistance at $10. A break above....
After showing so much strength as the price rallied from $1,024 to a region of $2,000 against tether (USDT) ahead of the anticipated merge, many call for a bull run and a $4,000 Ethereum price at the end of the “Ethereum Merge.” The price of Ethereum has not shown that run it showed in recent months as the price has struggled to break above $1,800. (Data from Binance) Related Reading: Why Cardano (ADA) Could Be Registering Another Decline, Analyst Explains Ethereum (ETH) Token Price Analysis On The Weekly Chart ETH saw a decline in its price from $4,500 to around $1,024, with....
The price of LoopRing (LRC) has shown no sign of relief bounce against Tether as it continues to range in its low region. Despite relief bounces shown by other cryptocurrencies across the market, some producing double-digit gains, LoopRing price continued to look dormant. (Data from Binance) Related Reading: ANKR Gained 12% In The Last 24 Hours. What’s Pushing It? LoopRing Price Analysis On The Weekly Chart From the chart, the price of LRC saw its weekly bottom at $0.35; the price of LRC bounced from that region to a price of $0.4 on the weekly chart as the price is unable to show much....