Bitcoin Price Technical Analysis for 11/25/2016 – Hold or Fold at Channel Support?
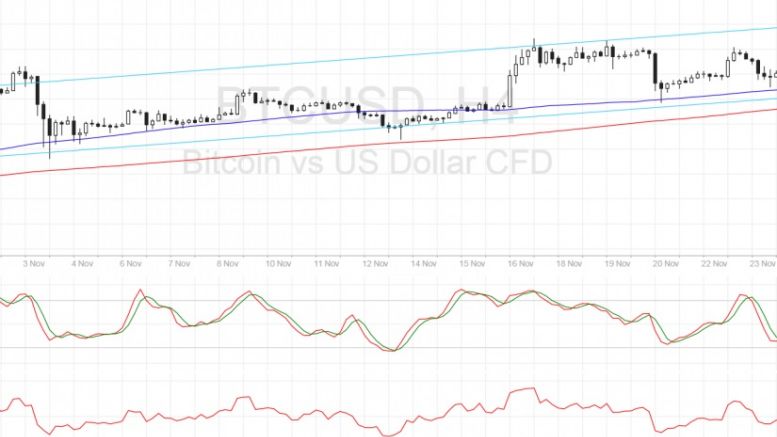
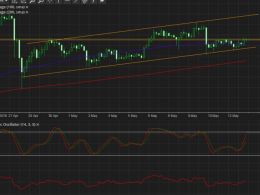
Bitcoin price is testing the ascending channel support visible on the 4-hour time frame and could be gearing up for another rally. Bitcoin Price Key Highlights. Bitcoin price is still trending higher on its 4-hour chart and moving inside the ascending channel previously marked. Price has pulled all the way back to the channel support around $740-745 after previously testing the yearly highs. There are several inflection points at this support zone so a bounce could be due, and technical indicators are suggesting that buyers are about to return. Technical Indicators Signals. The 100 SMA is....
Related News
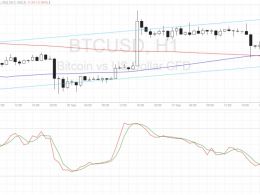
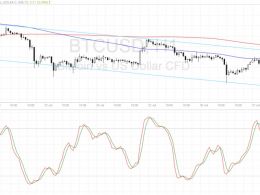
Bitcoin price is starting an uptrend on its 1-hour time frame and bulls could keep this rally going after a test of support. Bitcoin Price Key Highlights. Bitcoin price is slowly starting to trend higher on the short-term time frames once more, creating an ascending channel formation on its 1-hour chart. Price just came off a test of the channel resistance and is setting its sights back on support. Technical indicators are suggesting that the channel support could hold and allow bitcoin price to resume its climb. Technical Indicators Signals. The 100 SMA just crossed above the longer-term....
Bitcoin price might be able to test the 4-hour channel bottom if the short-term support breaks down. Bitcoin price is currently stalling at the 100 SMA, which might hold as a dynamic support level. Speaking of moving averages, the 100 SMA is still above the longer-term 200 SMA so the path of least resistance is to the upside and the uptrend could resume at some point. Meanwhile, the 200 SMA lines up with the bottom of the 4-hour channel support and could also hold as the line in the sand for any rallies. A break below this area could set off a downtrend. RSI is treading sideways, barely....
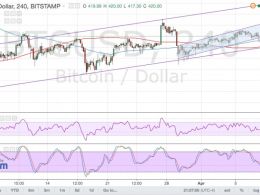
Bitcoin price could be due for a bounce off the channel support, with technical indicators reflecting the presence of buying momentum. Bitcoin Price Key Highlights. Bitcoin price has been steadily climbing on its 1-hour chart, moving inside an ascending channel pattern. Price bounced off the top of the channel once more and is now making a move towards support. If this area holds as a floor once more, bitcoin price could make its way back up to the channel resistance. Technical Indicators Signals. The 100 SMA just crossed above the 200 SMA to indicate that the path of least resistance is....
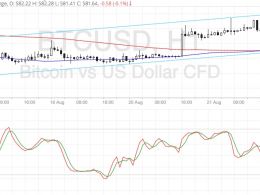
Bitcoin price has been consolidating at the bottom of the ascending channel, with buyers still trying to push for a bounce. Bitcoin Price Key Highlights. Bitcoin price has been trending higher and moving inside an ascending channel on its 4-hour and 1-hour time frames. Price is still hovering around the channel support and a bounce might be in order. If so, bitcoin price could make another test of the resistance around $465. Technical Indicators Settings. The 100 SMA is above the longer-term 200 SMA, confirming that the path of least resistance is to the upside and that the uptrend could....
Bitcoin price is hovering at the resistance of the short-term descending channel and could be in for a continuation or reversal. Bitcoin Price Key Highlights. Bitcoin price seems to be establishing a downtrend now that it’s forming a descending channel on its 1-hour time frame. Price is now testing the channel resistance, still deciding whether to make a bounce or a break. Technical indicators seem to be indicating that the selloff could resume but there are also potential arguments for a reversal. Technical Indicators Signals. The 100 SMA is below the longer-term 200 SMA so the path of....