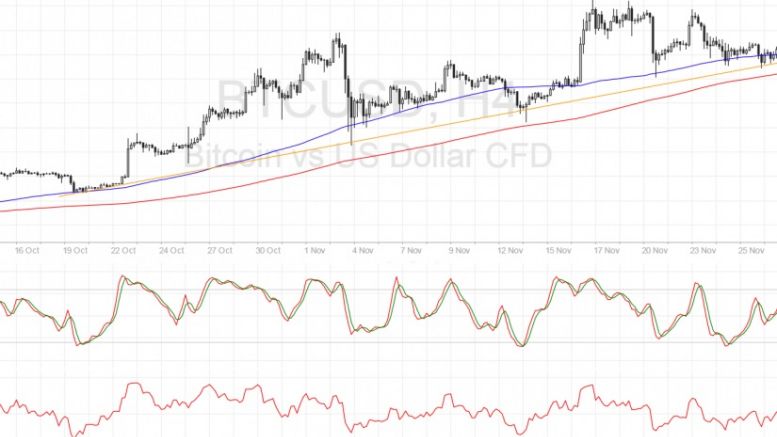
Bitcoin Price Technical Analysis for 11/30/2016 – The Battle Heats Up!
Bitcoin price is consolidating tightly right on the rising trend line support so a breakout might happen fairly soon. Bitcoin Price Key Highlights. Bitcoin price has been on an uptrend and is moving above a rising trend line visible on the 4-hour time frame. Price has been consolidating very close to the trend line recently, signaling that sellers are trying to push for a downside break. Price has also formed lower highs so selling pressure is mounting. Technical Indicators Signals. The 100 SMA is still above the longer-term 200 SMA so the path of least resistance is to the upside, which....
Related News

Bitcoin remains at the same price level from last week, reinforcing the $600 support area for the entire new cycle. Meanwhile, technical analysis indicates that bullish consensus is getting stronger, increasing the likelihood of a rally from $650 to $820. 5th Elliott Wave forecasting, based on Fibonacci numbers, could be calculated to the technical objective around the $820 area, where several theories point to the delayed next stage. From there, a technical correction should send prices back to $700, giving stragglers a second chance to recalculate their strategies to join. After another....

Banks are moving into crypto and crypto companies are trying to become banks, so how does it all play out?

Bitcoin price action has not made any significant change since the last analysis update. A review of the largest significant timeframe used for analysis reveals that a battle is raging at current levels in the charts. This analysis is provided by xbt.social with a 3 hour delay. Read the full analysis here. Not a member? Join now and receive a $29 discount using the code CCN29. Bitcoin Price Analysis. Time of analysis: 12h09 UTC. BTC-China 1-Day Chart. Also Read: Why The Preference For BTC-China Charts In Analysis? From the analysis pages of xbt.social, earlier today: The 1-day chart shows....
Bitcoin price seems poised for more declines, putting it on track towards testing a major support zone visible on the longer-term time frames. However, technical signals are looking mixed for now. At the moment, risk appetite appears to be waning once more, as the IMF recently decided to lower their global growth forecasts for 2016 and 2017. The institution highlighted the risks stemming from the slowdown in China and the slump in commodity prices, particularly to emerging economies. With that, the safe-haven US dollar is reigning supreme against most of its counterparts, particularly the....

Bitcoin price could be ready to resume its climb now that this area of interest held as support. Bitcoin Price Technical Analysis. Bitcoin price recently made an upside breakout from a near-term resistance around $660. Price has found resistance at the $670 area and has since pulled back to the broken resistance, which appears to have held as support. This signals that bitcoin bulls could be ready to charge once more, although technical indicators are suggesting otherwise. Technical Indicators Signals. The 100 SMA is still below the longer-term 200 SMA so the path of least resistance is to....