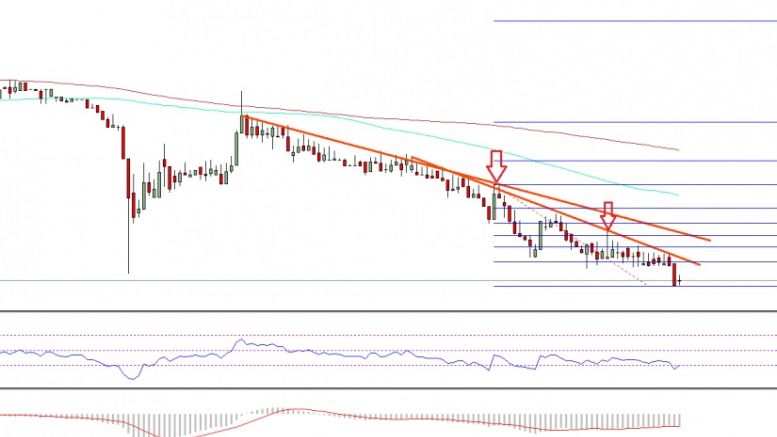
Ethereum Price Technical Analysis – ETH/USD at Continued Risk of Weakness
Ethereum price delinked below $8.50 against the US Dollar, and ETH/USD currently looks poised for further losses in the near term. Key Highlights. ETH price continued to move down against the US Dollar and Bitcoin, as buyers failed to show up. Yesterday’s highlighted bearish trend lines on the hourly chart (data feed via SimpleFX) of ETH/USD are still in play and acting as a resistance. There is a risk of a breakdown in ETH as long as the price is below $9.00. Ethereum Price Decline. There was no stopping the ETH sellers, as the price continued to move down. Many buyers are now annoyed,....
Related News

A crypto analyst, who publishes technical analysis to his audience on X, has released a zoomed-out weekly Ethereum chart that interprets the current price weakness as the final stage of a multi-year accumulation cycle. As it stands, the Ethereum price is trading around $2,100 and 57% below its peak. Therefore, the technical analysis is suggesting that […]

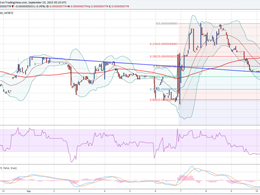
Ethereum has dropped 1.5 percent to 0.00197BTC, in line with our bearish expectations. We iterated our short view in the previous technical analysis titled Bitcoin-fueled bounce fades away. The price action in the past 24 hours has been strongly bearish and threatens a further 4% drop in the pair. Chart Structure – The underlying weakness in ETH-XBT forced the pair below the 20 4-h SMA (we discussed this possibility in the previous price analysis). The bulls did attempt to reverse the losses but failed miserably as the bears used the breached moving average as an offloading level. The pair....

In the previous Litecoin price technical analysis Flat Action, we discussed that if Litecoin fails to cross the resistance posed by the level of $3.160, it runs the risk of entering into a range. As can be seen, Litecoin has plummeted 4.44 percent to $2.907 as traders resorted to profit taking near the resistance. Another factor weighing on Litecoin is the weakness in the Bitcoin market. However, the good news is that Bitcoin is now close to its support level of $235. Values from the technical indicators overlaid on the daily LTC-USD price chart also suggest that there is an increased....

Dogecoin Price Key Highlights. Dogecoin price failed once again to trade above the 100 hourly moving average and declined intraday. The price continued to struggle and our forecast to target additional weakness remains intact. More losses are likely in the near term as long as the price is below 76.0. Dogecoin price fell one more time yesterday and almost tested the last low of 64.7 Satoshis, which is a strong bearish sign. How important is 100 MA? Dogecoin price fell intraday as forecasted in yesterday's analysis. We were anticipating a new low below 64.7 Satoshis, but the price managed....
DarkNote Price Key Highlights. DarkNote price tested a buy zone, which we highlighted in yesterday's technical analysis. The price is struggling to hold ground as sellers remained in control, creating a risk of a break below 0.00000078BTC. The price has moved below the 100 hourly simple moving average, which is warning sign in the short term. DarkNote price looks like at a risk of more losses, but as long as it is above the broken trend line there is a hope. Risk of More Downsides? The DarkNote price continued to move down after testing a major swing area of 0.00000090BTC and completing a....