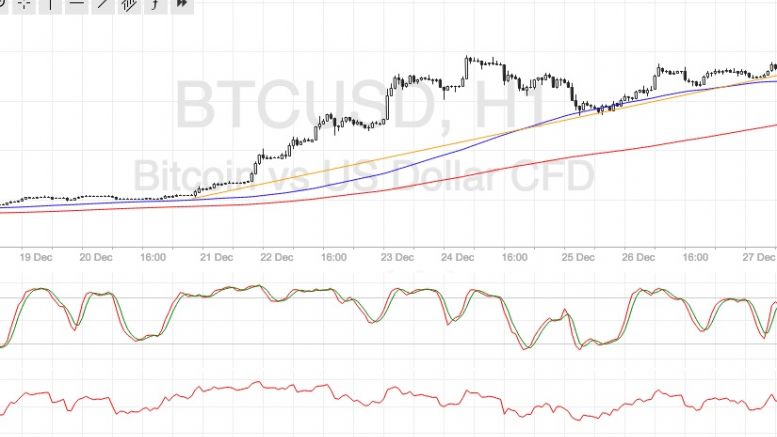
Bitcoin Price Technical Analysis for 12/28/2016 – Closing in on $1000!
Bitcoin price seems unstoppable in its climb as it is gunning for the $1000 level, which could be a profit-taking point. Bitcoin Price Key Highlights. Bitcoin price continued its ascent yesterday, taking out the $950 psychological barrier and setting its sights on $1000 next. A rising trend line can be drawn to connect the recent lows of price action, illustrating potential support levels in the event of a pullback. Profit-taking could ensue at the $1000 level since this represents a major psychological number. Technical Indicators Signals. The 100 SMA is above the 200 SMA on the 1-hour....
Related News
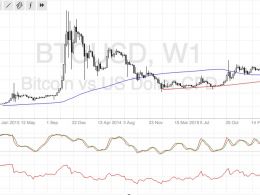
Bitcoin price could be in for more gains past $1000 as long-term candles show no signs of reversal just yet. Bitcoin Price Key Highlights. Bitcoin price seems unstoppable in its climb, as strong bullish candles have formed on the weekly chart. The $1000 handle held as near-term resistance as predicted in the previous article since short-term traders likely booked some profits there. Still, the strength of the rally on the longer-term charts indicates that bulls have enough energy left in them. Technical Indicators Signals. The 100 SMA remains above the 200 SMA on the weekly chart,....
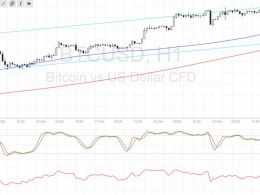
Bitcoin price could make a correction before resuming its climb past the $1000 mark and the short-term time frames illustrate potential pullback areas. Bitcoin Price Key Highlights. Bitcoin price seems to be having trouble breaking past the $1000 mark so a pullback might be in order. On the 1-hour time frame, an ascending channel can be seen and a pullback to support at $940 might be in the works. The channel support lines up with a broken resistance area and another dynamic inflection point. Technical Indicators Signals. The 100 SMA is above the longer-term 200 SMA so the path of least....
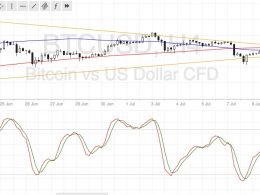
Bitcoin price could be due for a strong break out of its consolidation pattern, but traders still seem to be undecided which way to push. Bitcoin Price Technical Analysis. Bitcoin price is still stuck in its consolidation pattern visible on the 4-hour time frame. Price is already at the peak of the symmetrical triangle formation, which means that a breakout could take place anytime now. Technical indicators and market sentiment appear to be hinting at a downside break. Technical Indicators Signals. The 100 SMA is below the 200 SMA so the path of least resistance is to the downside. A....
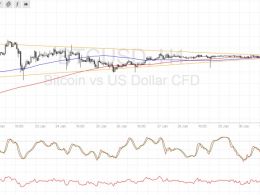
Bitcoin price zoomed up to the $1000 area after breaking above consolidation, signaling a return in bullish momentum. Bitcoin Price Key Highlights. Bitcoin price finally made a break out of its tight consolidation pattern highlighted in the previous article. Price made an upside break and went all the way up to the next ceiling at $1000 as expected. Weakness in US markets is starting to take effect on bitcoin price as talks of currency devaluation swirled. Technical Indicators Signals. The 100 SMA is still above the 200 SMA on the 1-hour time frame, narrowly avoiding a downward crossover.....
Bitcoin price is pushing closer to its November closing highs and technical analysis suggests a price correction to the downside is due. This analysis is provided by xbt.social with a 3-hour delay. Read the full analysis here. Not a member? Join now and receive a $29 discount using the code CCN29. Bitcoin Price Analysis. Time of analysis: 14h30 UTC. BTCC 1-Hour Chart. From the analysis pages of xbt.social, earlier today: So far, so good for our trade from $315 and 2730 CNY that now seems to be reaching a ceiling. The price wave may not reverse here, but draw sideways before another wave of....

