Bitcoin Has Rallied through Resistance
Bitcoin. Bitcoin surprised me this morning with a strong push through resistance on multiple timeframes. As you can see on the daily chart below, price has pushed significantly past the 1st arc on the setup from the 750 low (see red arrow). While technically this is not a buy signal until we have a close above the arc, it seems highly likely that we will be given a buy signal on the daily chart in 16 hours or so. This does not necessarily mean that the correction is over. However, it means that there is a good chance that price will rally to the 2nd arc within the next day or two (or....
Related News
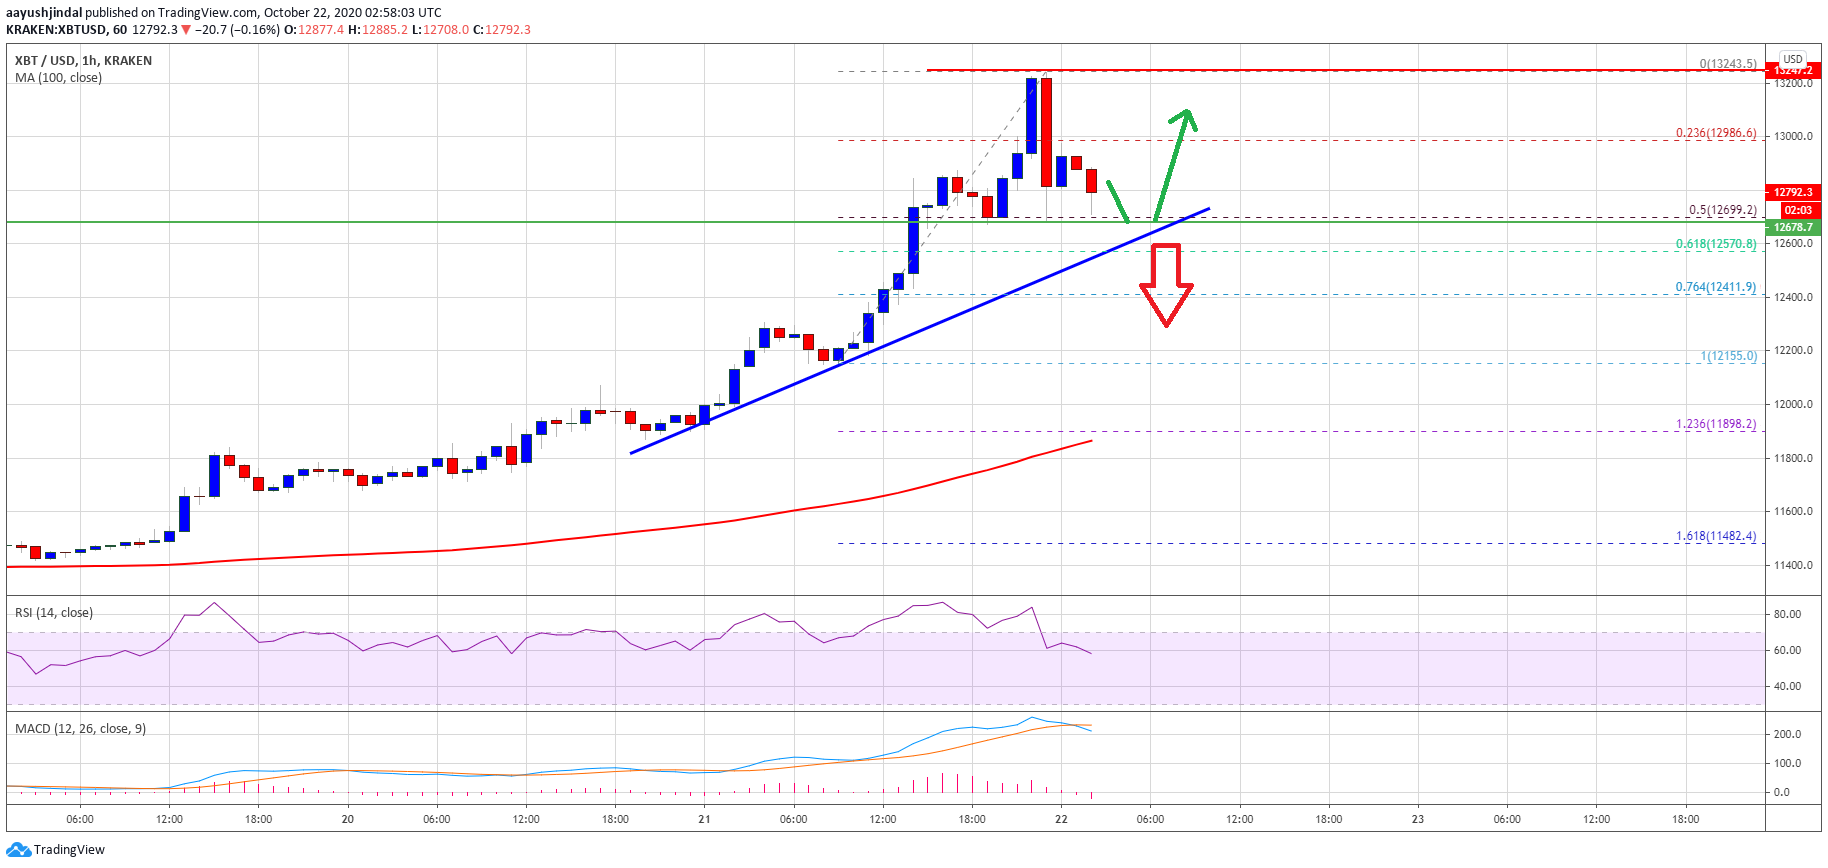
Bitcoin price rallied more than 5%% and it even broke the $13,000 resistance against the US Dollar. BTC is now correcting gains, but there are key supports near $12,500. Bitcoin gained bullish momentum and it rallied above the $12,500 and $13,000 resistance levels. The price traded to a new monthly high at $13,243 and it […]
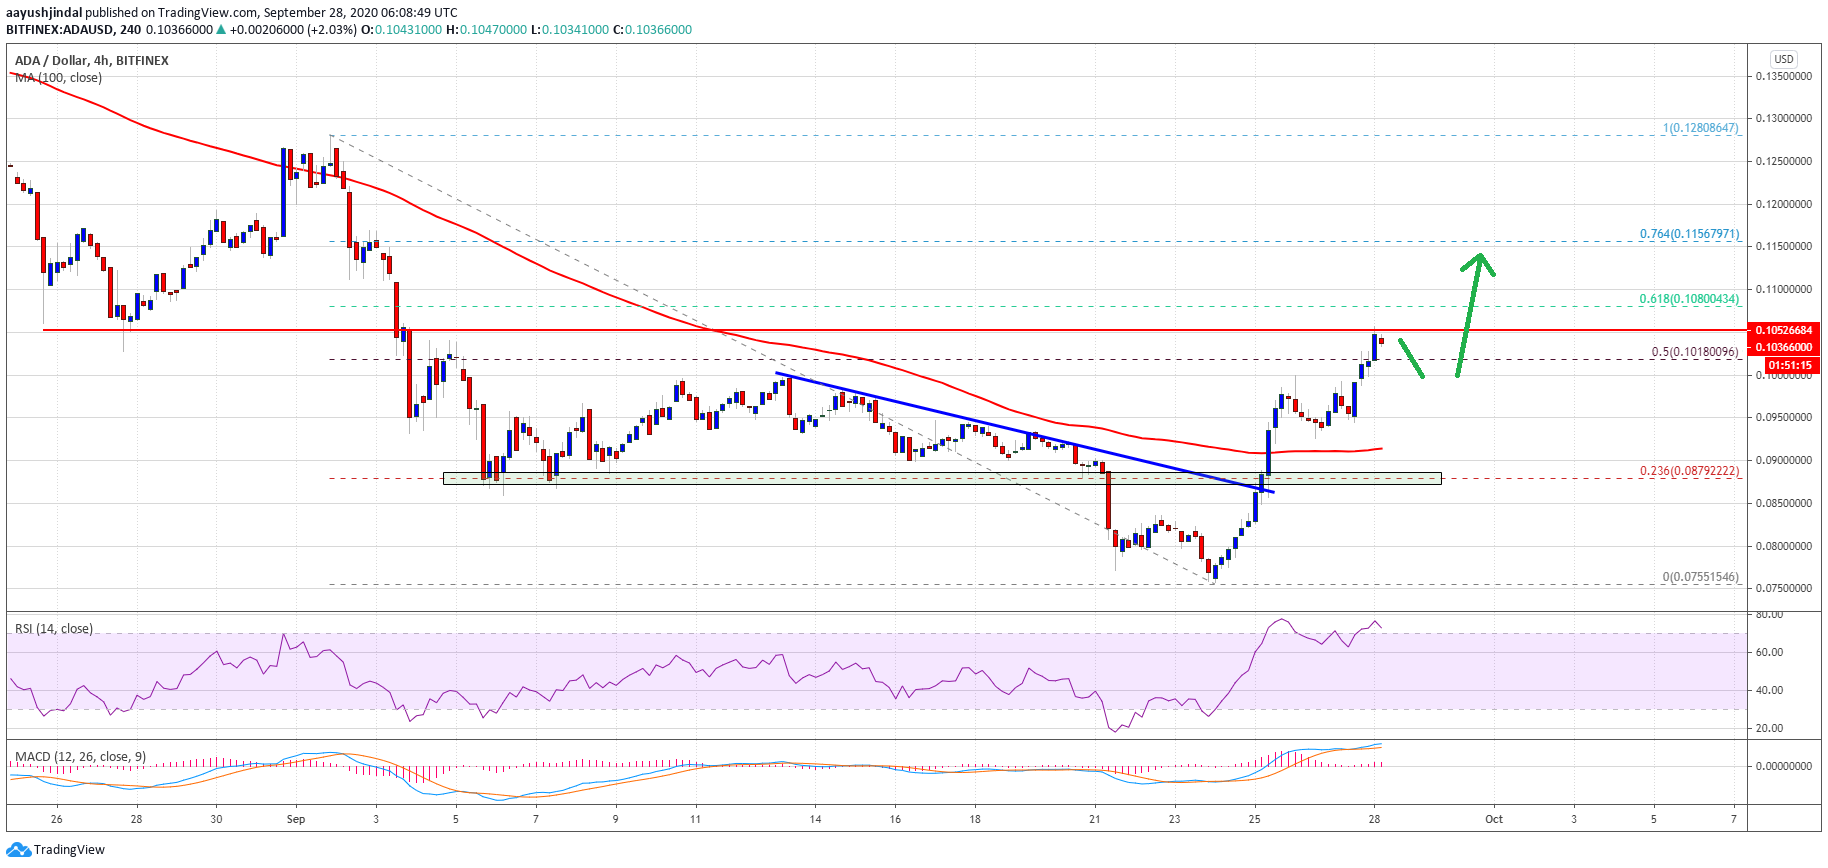
Cardano’s price rallied more than 8% and it broke the $0.1000 resistance. ADA is likely to accelerate higher once it surpasses the key $0.1050 resistance zone. ADA is up over 8% and it broke the $0.1000 resistance zone against the US dollar. The price is currently testing the $0.1050 resistance and trading above the 100 […]
The price of Ethereum (ETH) showed so much strength but has been hit with resistance against Tether (USDT) as the Ethereum merge is announced. Ethereum price rallied with so much strength from a region of $1,670 to $1,924, as bulls anticipate the Ethereum merge from proof-of-work (POW) to proof-of-stake (POS). Related Reading: Will Ethereum Breach $2,000 Before The Merge? Ethereum merge is an upgrade on the Ethereum network from POW to POS so as to increase its network efficiency in transactions. (Data feeds from Binance) Ethereum Price Analysis On The Weekly Chart From the chart, the....
Litecoin has been consolidating since finding support at 1.32 This consolidation follows a 3-point divergence between price and the RSI. Then, after a failed bearish attempt to test 1.32, price rallied again and rallied up to 1.46 before finding resistance. Litecoin (LTCUSD) 1H Chart April 17. In the 1H chart, we can see that there was resistance around 1.45-1.46, which was a common support from a previous consolidation. As price falls, we should watch what happens around 1.37. If ltcusd breaks below 1.37, it would break below the 100-, and 50-hour simple moving averages (SMAs) and this....
Bitcoin price rallied above the $28,800 resistance. BTC is up over 6% and it could rise further above the $30,500 resistance zone. Bitcoin climbed higher and was able to clear the $30,000 resistance zone. The price is trading above $30,000 and the 100 hourly Simple moving average. There was a break above a bullish continuation pattern with resistance near $28,300 on the hourly chart of the BTC/USD pair (data feed from Kraken). The pair could extend its increase if it clears the $30,500 resistance level. Bitcoin Price Gains Bullish Momentum Bitcoin price formed a fresh support base above....


