Bitcoin Price Technical Analysis for 01/23/2017 – Slow and Steady Climb
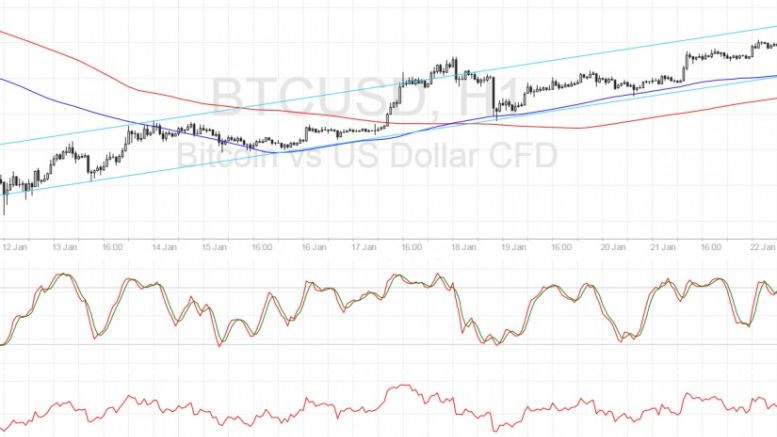
Bitcoin price is still keeping up its uptrend but bulls seem to be having a difficult time pushing for more gains. Bitcoin Price Key Highlights. Bitcoin price is still crawling inside its ascending channel pattern visible on the 1-hour time frame. Price seemed to make a downside break from support but the dynamic inflection points held as a floor and kept it on an uptrend. Technical indicators seem to be hinting that the climb could carry on, albeit at a slow pace. Technical Indicators Signals. The 100 SMA is above the longer-term 200 SMA so the path of least resistance is to the upside.....
Related News
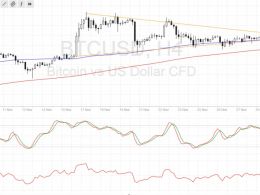
Bitcoin price followed through with its consolidation breakout and sustained its climb. Bitcoin Price Key Highlights. Following the recent upside breakout from the symmetrical triangle pattern, bitcoin price continued to climb as predicted in the earlier post. Price has now made its way to the triangle highs around $780 and is showing increased buying pressure to form new highs. Technical indicators are giving mixed signals at the moment, but it looks like the odds are in favor of more bullish action. Technical Indicators Signals. The 100 SMA is above the 200 SMA so the path of least....
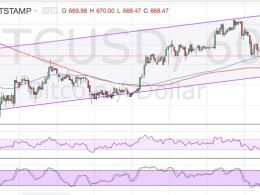
Bitcoin price could be due for a test of the ascending channel resistance visible on its 1-hour time frame. Bitcoin Price Key Highlights. Bitcoin price recently sold off but found support around the $650 area as predicted in an earlier article. This was in line with the 200 SMA, which held as a dynamic support level. Bullish pressure seems to be building up again as an ascending channel is forming. Technical Indicators Signals. Bitcoin price made a quick spike on its test of the channel support, indicating that buyers are putting up a fight and ready to push price back up to the top of the....

XRP’s price has been showing signs of consolidation in recent days and oscillating between $2.30 and $2.50. The entire crypto market has been relatively steady, and XRP has managed to maintain its footing above $2.20. Despite the slow momentum, a technical analysis shared by the crypto analyst known as ChartNerd on X suggests that XRP could be preparing for a massive breakout that could take it from current levels toward a long-term target above $27. The analysis is supported by a chart showing multiple confluences aligning in favor of such a large-scale move. XRP Technical Analysis....

Bitcoin trading has corrected yesterday's advance and is now building the base of the next wave of advance. 1590 CNY and $256 (Bitfinex) remain tough resistance levels and 24 hours later trading has developed a knee-jerk sell reaction to this chart level. This analysis is provided by xbt.social with a 3 hour delay. Read the full analysis here. Bitcoin Trading and Price Analysis. Time of analysis: 13h37 UTC. Bitfinex 15-Minute Chart. From the analysis pages of xbt.social today: Price is still holding above the Fib line immediately below and making slow, but steady progress in building the....

Data shows the Bitcoin mining hashrate seems to have hit a plateau since the beginning of March, after observing a steady rise for many months. Bitcoin Mining Hashrate Has Mostly Moved Sideways In The Past Month According to the latest weekly report from Arcane Research, the BTC hashrate has broken its upwards movement and has […]