Ethereum Price Technical Analysis – ETH/USD To Decline Further
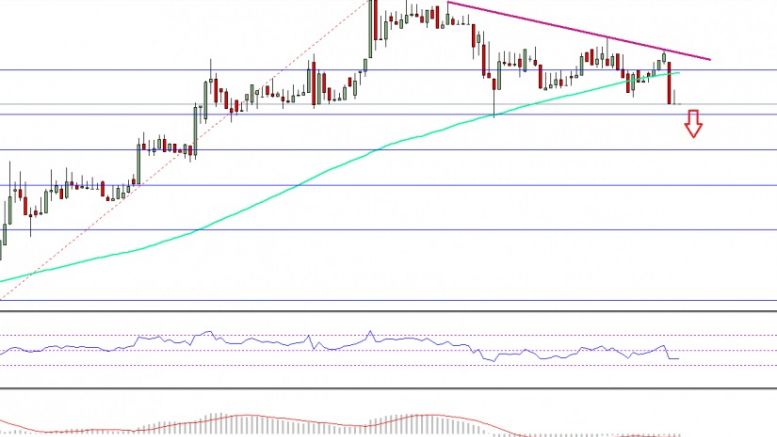
Ethereum price started a substantial correction yesterday against the US Dollar, and it looks like ETH/USD may trade towards $10.20 in the short term. Key Highlights. ETH price started a correction after trading as high as $10.84 against the US Dollar. There is a bearish trend line formed on the hourly chart (data feed via SimpleFX) of ETH/USD, which is pushing the price down with resistance near $10.55. The pair has also moved below the 100 hourly simple moving average at $10.54, which is a bearish sign. Ethereum Price Correction. Yesterday, I highlighted the start of a correction in ETH....
Related News
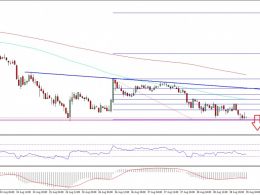
Ethereum price tumbled recently, and traded towards $8.00. It was a perfect sell, and it looks like the bulls may be exhausted. Ethereum price ETH was down and out, as there was a sharp downside move towards the $8.00 support area. I mentioned in my previous analysis that there is a chance of a decline in ETH/USD due to the technical indicators. It was a perfect sell, and the final target of $8.0 was achieved. There was a bearish trend line on the hourly chart (data feed via Kraken) of ETH/USD, which acted as a perfect catalyst for a decline. The price traded below $8.0, and a new low of....
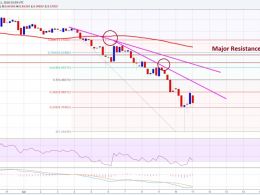
Ethereum classic price faced a lot of offers recently versus Bitcoin, and it may continue to face sellers in the near term. Key Highlights. Ethereum classic price continued to weaken against Bitcoin and looks set for more losses moving ahead. There is a bearish trend line formed on the hourly chart of ETC/BTC (data feed via Simplefx), which may act as a hurdle if the price recovers. It looks like the ETC may decline further and test the all-important 0.0020BTC level. Ethereum Classic Price Decline. Ethereum classic price failed to move higher against Bitcoin and traded lower. In my last....

A crypto analyst, who publishes technical analysis to his audience on X, has released a zoomed-out weekly Ethereum chart that interprets the current price weakness as the final stage of a multi-year accumulation cycle. As it stands, the Ethereum price is trading around $2,100 and 57% below its peak. Therefore, the technical analysis is suggesting that […]

Bitcoin price has wound sideways during today's Asian and European trading sessions. At least one more wave of decline is due, as evident from technical analysis of the price chart. This analysis is provided by xbt.social with a 3 hour delay. Read the full analysis here. Not a member? Join now and receive a $29 discount using the code CCN29. Bitcoin Price Analysis. Time of analysis: 10h49 UTC. Bitfinex 1-Hour Chart. Why The Preference For BTC-China Charts In Analysis? From the analysis pages of xbt.social, earlier today: As we approach the $215 / 1350 CNY support level, we'll be looking....

BTC-China was leading a decline of today's price wave to the downside. The decline reversed at $235.02 (Bitfinex) and 1460 CNY (BTC-Cina). Technical analysis looks at the prospects for the coming days, and we examine the lull in Bitcoin price movement during the past few weeks. This analysis is provided by xbt.social with a 3 hour delay. Read the full analysis here. Not a member? Join now and receive a $29 discount using the code CCN29. Bitcoin Price Analysis. Time of analysis: 15h50 UTC. BTC-China 15-Minute Chart. Why The Preference For BTC-China Charts In Analysis? From the analysis....