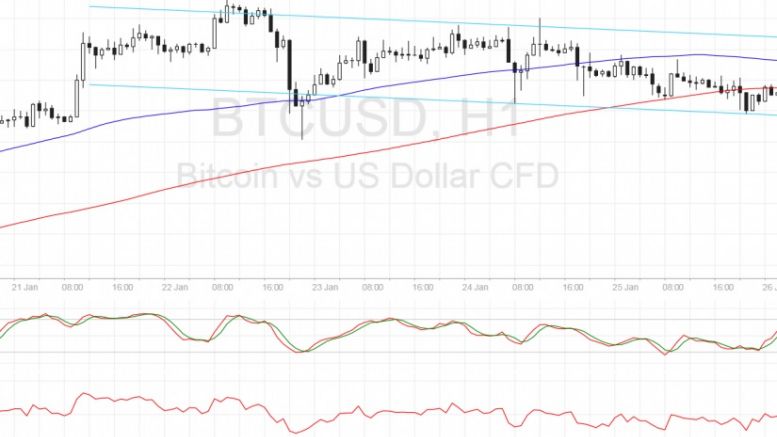
Bitcoin Price Technical Analysis for 01/26/2017 – New Channel in the Works
Bitcoin price is slowly making its way down, moving inside a descending channel on its short-term time frames. Bitcoin Price Key Highlights. Bitcoin price seems to have broken below the descending triangle pattern illustrated in an earlier article. Price is establishing short-term downside momentum from here, creating a descending channel visible on the 1-hour chart. Price just bounced off the channel support and could be due for a test of resistance at $930. Technical Indicators Signals. The 100 SMA is above the longer-term 200 SMA so the path of least resistance is still to the upside.....
Related News
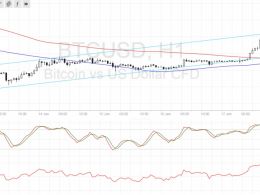
Bitcoin price is still safely inside its ascending channel, with technical indicators confirming that the climb could carry on. Bitcoin Price Key Highlights. Bitcoin price continues to tread higher slowly, moving inside an ascending channel pattern visible on its 1-hour chart. Price just tested the channel resistance on a new wave higher and might be on its way towards testing support. Technical indicators also seem to be warming up to the idea of an uptrend in bitcoin price. Technical Indicators Signals. The 100 SMA is attempting to cross above the longer-term 200 SMA to indicate that the....
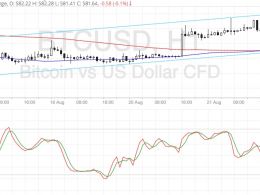
Bitcoin price is testing the ascending channel support, still deciding whether to resume the uptrend or break lower. Bitcoin Price Key Highlights. Bitcoin price is still trending higher, moving inside the ascending channel visible on its 1-hour time frame. As illustrated in the earlier article, price made its way back to the channel support after getting rejected on its test of resistance. Support around $580 seems to be holding so far and technical indicators are suggesting that the climb could continue. Technical Indicators Signals. The 100 SMA is above the longer-term 200 SMA, hinting....
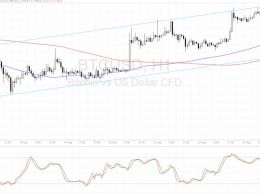
Bitcoin price is stuck in a tighter consolidation pattern, which could set the tone for an even more explosive breakout. Bitcoin Price Technical Analysis. Bitcoin price is starting to form a new ascending channel after its previous breakdown. The consolidation is noticeably tighter these days, which suggests that price could be gearing up for a strong breakout. The US elections would likely have a strong impact on financial market sentiment and dollar price action. Technical Indicators Signals. The 100 SMA just crossed below the longer-term 200 SMA so the path of least resistance is now to....
Bitcoin price could be due for a bounce off the channel support, with technical indicators reflecting the presence of buying momentum. Bitcoin Price Key Highlights. Bitcoin price has been steadily climbing on its 1-hour chart, moving inside an ascending channel pattern. Price bounced off the top of the channel once more and is now making a move towards support. If this area holds as a floor once more, bitcoin price could make its way back up to the channel resistance. Technical Indicators Signals. The 100 SMA just crossed above the 200 SMA to indicate that the path of least resistance is....
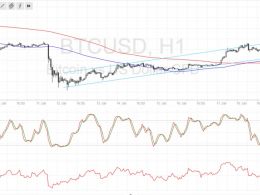
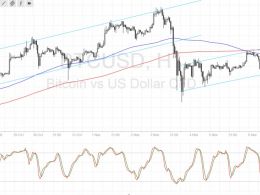
Bitcoin price is encountering a lot of roadblocks on its move up north for now so bears might take advantage and push for a drop. Bitcoin Price Key Highlights. Bitcoin price is still moving inside its ascending channel pattern on the 1-hour chart but bears seem to be pushing for a downside break. Price has been hovering too close to the channel support for quite some time, which means that bulls are having trouble sustaining the climb. A break below the channel support could mark the start of a selloff until the next lows at $700-750. Technical Indicators Signals. The 100 SMA has just....