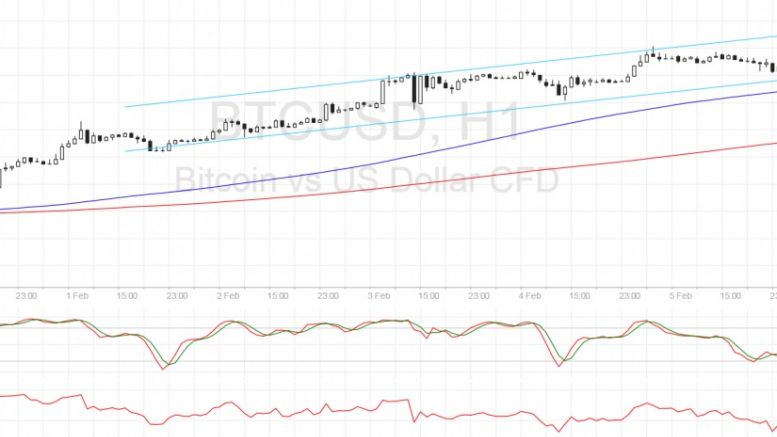
Bitcoin Price Technical Analysis for 02/06/2017 – Ready to Bounce Again!
Bitcoin price could be ready to resume its rally now that price is testing a support area seen on the short-term chart. Bitcoin Price Key Highlights. Bitcoin price sold off in the past few hours as profit-taking took place off the near-term resistance. Price is still trading safely inside an ascending channel visible on the 1-hour chart and is currently testing support. A bounce off this support area could take bitcoin price back up to the channel resistance at $1100. Technical Indicators Signals. The 100 SMA is above the longer-term 200 SMA on this chart so the path of least resistance is....
Related News
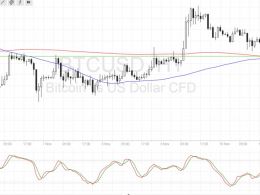
Bitcoin price pulled back from its recent rally and is finding support at a former resistance level. Bitcoin Price Technical Analysis. Bitcoin price is currently testing an area of interest and might be due for a bounce. The broken resistance around $715 is holding as support for the time being. Technical inflection points are also lining up with this area of interest. Technical Indicators Signals. The 100 SMA just crossed above the longer-term 200 SMA so the path of least resistance is to the upside. In addition these moving averages coincide with the former resistance around $715, adding....
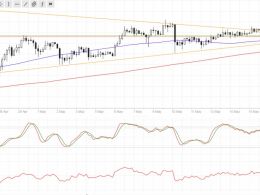
Bitcoin price could be due for a triangle breakout this week as there are top-tier catalysts on deck. Bitcoin Price Key Highlights. Bitcoin price is still stuck inside its symmetrical triangle consolidation pattern on the 4-hour time frame. Price is hovering close to the support around $450 for now, still deciding whether to make a bounce or break. A bounce could lead to a test of resistance at $455 while a breakdown could trigger a longer-term downtrend for bitcoin. Technical Indicators Signals. The 100 SMA is above the 200 SMA on the 4-hour time frame so a bounce seems more likely.....
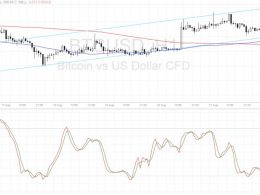
Bitcoin price could be ready for another bounce off the channel support as the bullish trend goes on. Bitcoin Price Key Highlights. Bitcoin price is still inside that ascending channel on its 1-hour time frame, bouncing off support as suggested in the earlier article. Price just got rejected on its test of the channel resistance once more, putting it back on track towards testing support. Technical indicators are suggesting that a pullback could take place but that the bullish trend could continue. Technical Indicators Signals. The 100 SMA is above the longer-term 200 SMA so the path of....

Ethereum Price Key Highlights. Ethereum price appears to be creating a range on its 1-hour time frame, unable to sustain its momentum after an earlier breakout. Price found resistance at 0.00300 and support at the 0.00285 area. Ethereum price just bounced off the top of its range and may be ready to test the bottom once more. Ethereum price could continue with its sideways movement, as technical indicators aren't offering any signals for directional plays. Short-Term Profit Opportunities. With that, ethereum traders might simply go for short-term gains, buying off support and selling at....

Bitcoin price could be ready to resume its climb now that this area of interest held as support. Bitcoin Price Technical Analysis. Bitcoin price recently made an upside breakout from a near-term resistance around $660. Price has found resistance at the $670 area and has since pulled back to the broken resistance, which appears to have held as support. This signals that bitcoin bulls could be ready to charge once more, although technical indicators are suggesting otherwise. Technical Indicators Signals. The 100 SMA is still below the longer-term 200 SMA so the path of least resistance is to....