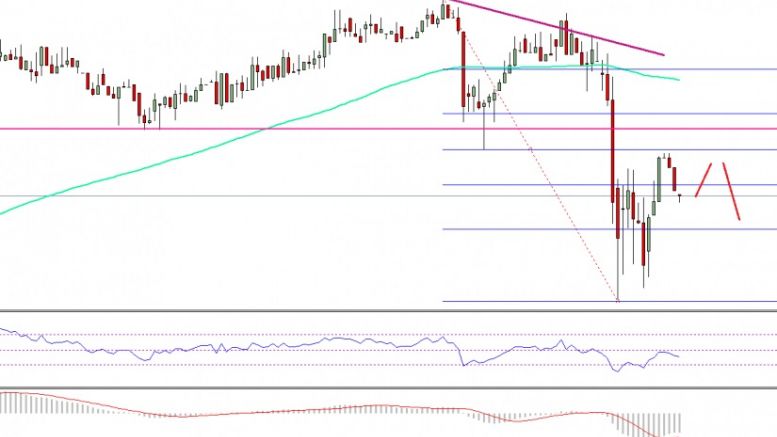
Ethereum Price Technical Analysis – ETH/USD Nosedives Below $11.00
Ethereum price declined sharply as two Bitcoin exchanges in China suspended withdrawals. ETH/USD is under heavy pressure, and may decline further. Key Highlights. ETH price after initiating a break yesterday at $11.30 against the US Dollar started a downtrend. Yesterday’s highlighted bearish trend line on the hourly chart of ETH/USD (data feed via SimpleFX) acted as a barrier at $11.20 and pushed the price down. The price traded sharply lower, and also broke the last swing low at $10.80. Ethereum Price Decline Initiated. Yesterday, there were signs of a downtrend in ETH price against the....
Related News

A crypto analyst, who publishes technical analysis to his audience on X, has released a zoomed-out weekly Ethereum chart that interprets the current price weakness as the final stage of a multi-year accumulation cycle. As it stands, the Ethereum price is trading around $2,100 and 57% below its peak. Therefore, the technical analysis is suggesting that […]
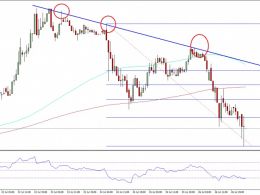
Ethereum price registered heavy losses and even closed below the $12.00 handle against the USD. Can the price recover moving ahead? Key Highlights. Ethereum price dived sharply against the US Dollar, and one of the main reasons could be Ethereum classic price surge. Yesterday’s highlighted bearish trend line on the hourly chart (data feed via Kraken) of ETH/USD acted as a perfect barrier in pushing the price down. There was a heavy bearish pressure noted on ETH/USD, which could stay here for some time. Ethereum Price Weakness. Ethereum price ETH was under a lot of bearish pressure during....

Ethereum classic price traded down further versus Bitcoin. ETC broke a major support area and now may decline further. Key Highlights. Ethereum classic price struggle to recover continued against the Bitcoin, and as it traded down further. There was an expanding triangle pattern formed on the hourly chart of ETC/BTC (data feed via Simplefx), which was broken during the recent downside break. The price is now well below the 0.00200BTC support, which may now act as a resistance. Ethereum Classic Price Support Break. Ethereum classic price was seen consolidating above the 0.00198BTC support....

Ethereum has started to show signs of life again after weeks of muted price action, but one analyst believes the current move is only the beginning of something much larger. This inclination is based on a technical setup built around a hidden inefficiency zone after the Ethereum price recently broke above $4,500. The technical analysis shows that the unfilled gap may be the first waypoint in a recovery that eventually pushes the ETH price to five figures above $10,000. The FVG Zone Now Acting As A Magnet Technical analysis done by crypto analyst Crypto Patel laid out a path to where the....

Ethereum is trading very flat in a dull session as bitcoin remains undecided about the future direction. Currently at 0.00191BTC, Ethereum is in a no trade zone as discussed in the previous technical analysis. Sole Positive – The technical indicators are, however, rebounding from the respective oversold levels. I would like to discuss the resistance and support levels for Ethereum now. To serve this purpose, I will be using the 4-h ETH-XBT pair. Chart Structure – The pair has been registering lower tops and lower bottoms for the past 10 trading sessions. Connecting the two highs in this....