
Uniswap analysis: UNI price can double based on a classic technical pattern
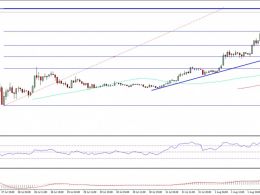
UNI needs to break above a key technical resistance level to trigger its 100% bull run scenario. Otherwise, a bear flag awaits a 45% price crash. Uniswap (UNI) market valuation could grow by 100% in the second half of 2022 as it paints a classic bearish reversal pattern.UNI price bullish setupDubbed "inverse head and shoulders (IH&S)," the technical setup takes shape when the price forms three troughs in a row below a common support level (neckline), with the middle one (head) deeper than the other two (shoulders). Additionally, it resolves after the price breaks above the support....
Related News
Ethereum classic price continued its uptrend and gained by more than 20%. However, I feel it may be topping soon for a short-term correction. Key Highlights Ethereum classic price surged higher against Bitcoin and traded close to the 0.0048BTC level. There is likely a double top pattern forming around the mentioned level, so the bulls need to be very careful. There is a bullish trend line formed on the hourly chart of ETC/BTC, which may act as a support if the price corrects lower. Ethereum Classic Price Resistance Ethereum classic price ETC surged further during the past 24 hours against....

Ethereum (ETH) has witnessed a notable resurgence, reclaiming ground after hitting a crucial support level at $1,500. As traders analyze the daily time frame, it becomes evident that this resurgence may signify the formation of a bullish reversal pattern, known as a double bottom. A double bottom is a classic technical analysis pattern that often […]
Dogecoin Price Key Highlights. Dogecoin price as mentioned yesterday formed a double top pattern near the last swing high of 67.0. We need to wait for a break in order for the price to move lower and retest 60.0. The price is attempting to close below the 100 hourly simple moving average, which is a negative sign for buyers. Dogecoin price formed a double top pattern recently, and if sellers gain control more losses are possible moving ahead. Double Top Formation. We highlighted in yesterday's analysis that the Dogecoin price formed a double top pattern on the hourly chart, as there were....
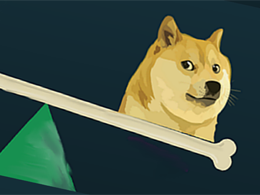
Dogecoin Price Key Highlights. Dogecoin price continued to remain under the bearish pressure, and our highlighted double top pattern is still in play. There is a cluster of resistance formed on the upside for buyers around 56.0-57.0 Satoshis. The price continued to consolidate near the 100 hourly simple moving average, as there was no break. Dogecoin price remains at risk of a break lower since our highlighted double top pattern is still in play. Double Top Pattern. We highlighted a double top pattern yesterday, which is still in play and might act as a catalyst for a downside move in the....
Technical indicators are pointing to a major breakdown of the Dogecoin price, as an analyst projects a decline to $0.2. This bearish prediction could be game over for Dogecoin, as the meme coin has formed a Double Top pattern, indicating that it may experience further downside pressure this quarter. Double Top Pattern Signals Dogecoin Price […]