
Bitcoin price falls below its ‘realized price’ but is it time to buy the dip?
Another wave of selling hit BTC and sent its price to lows not seen since December 2020. Does on-chain data suggest this dip is worth buying? On June 13, cryptocurrency prices plunged deeper into bear market territory after Bitcoin (BTC) sliced through its current trading range and briefly touched $22,600, its lowest level se since December 2020.According to BTC historical data, the market has now reached valuation metrics that show the price is severely oversold and perhaps near a bottom. Bitcoin has now fallen below its realized price, which represents the average price of every coin in....
Related News

After what seemed like a strong start to September, the Bitcoin price is pretty much back where it began the month. With the historically bullish “Uptober” now in sight, investors are hoping that the premier cryptocurrency will be able to find some relief and perhaps enjoy some upward momentum in the coming weeks. However, the latest on-chain revelation suggests that the Bitcoin price is at risk of further downward pressure over the next few weeks. According to a prominent analyst on social media platform X, the market leader has fallen below a crucial level, which could trigger a further....
On-chain data shows Solana (SOL) has seen its spot value drop under the Realized Price for the first time in three years following the recent bearish action. Solana Has Just Seen A Breakdown Of The Realized Price According to data from the on-chain analytics firm Glassnode, Solana has slipped around 8% below its Realized Price. The “Realized Price” is an indicator that basically tells us about the cost basis of the average investor or address on a given network. Related Reading: Dogecoin To $2 Could Be Next If DOGE Holds This Level: Analyst When the spot price of the asset is....
Bitcoin’s price recently experienced another significant downturn, falling below $80,000 earlier today—a nearly 20% decrease in just the past week. This prolonged slump highlights the broader challenges facing the market, with minimal signs of recovery in sight. Amid this turbulent price activity, insights from tugbachain, a contributor to the CryptoQuant QuickTake platform, have shed light on an intriguing trend within the Bitcoin market: the shifting patterns of UTXO Realized Price Age Distribution. Related Reading: Bitcoin’s 60-Day CDD Spikes: A Warning Sign or Buying Opportunity? UTXO....
The Bitcoin price is lingering just under $19,000 at the time of writing, not far from the local low of $18,300. When the Consumer Price Index (CPI) and Producer Price Index (PPI) data was released last week, the BTC price plunged to just that price level. Unexpectedly for many, a very quick rebound happened, catching shorters off guard. With November 02 – when the FED meets again – in mind, the Bitcoin price doesn’t have much room to fall below that level at the moment. Moreover, a look at the on-chain suggests another crash is possible in the short term, although there....
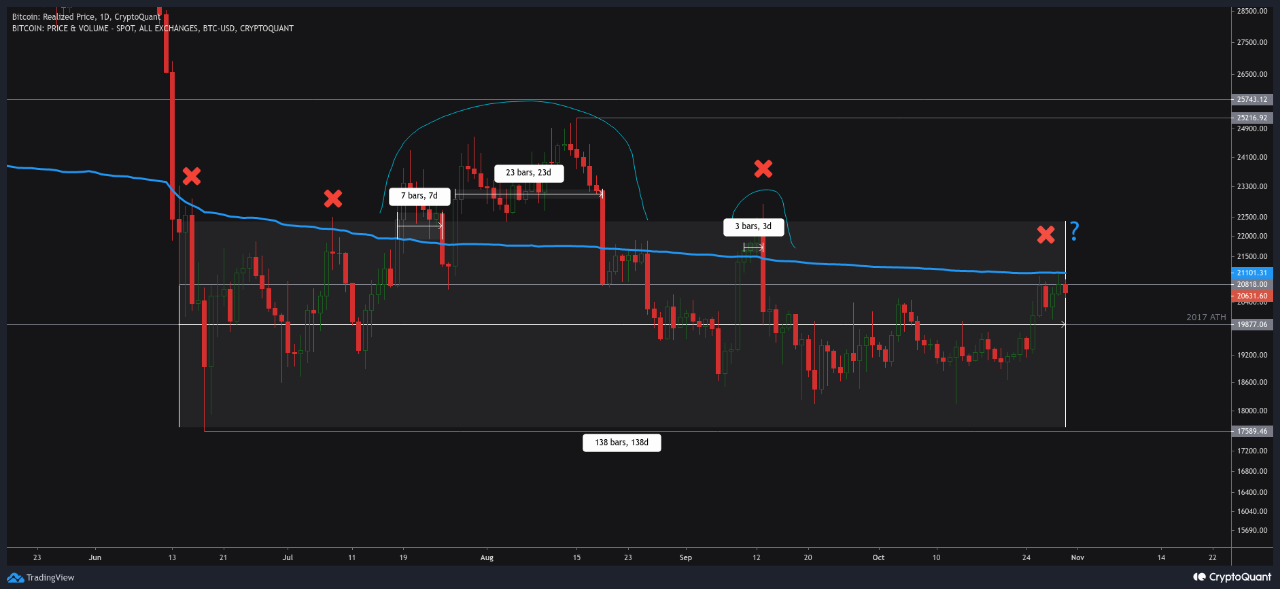
Data shows Bitcoin is now approaching another retest of the realized price, will the bulls be able to blow through the resistance this time? Bitcoin’s Recent Upwards Momentum Has Brought It Near Realized Price Again As pointed out by an analyst in a CryptoQuant post, BTC has spent a total of 138 days under the realized price so far since the June of this year. Before we look at the data for the Bitcoin realized price, it’s best if a basic understanding of the “realized cap” is attained first. The realized cap is calculated by multiplying each coin in the circulating....