
Bitcoin Price Rebounds From Monthly Channel Bottom, Could $475,000 Be Next?
Over the weekend, the Bitcoin price and the crypto market witnessed significant pressure amid escalating tensions between the United States and Iran. After reports of Israeli strikes on Iran, the premier cryptocurrency dropped below $64,000 while dragging the rest of the market along with it. While the price of BTC seems to have recovered from […]
Related News

A cryptocurrency analyst has pointed out how XRP has bounced off the bottom level of a Parallel Channel and could be headed toward its midway line. XRP Recently Found Support At The Lower Line Of A Parallel Channel In a new post on X, analyst Ali Martinez has discussed about a technical analysis (TA) pattern forming in the 3-day price of XRP. The pattern in question is a “Parallel Channel,” appearing whenever an asset’s price consolidates between two parallel trendlines. Related Reading: Capriole Founder Not Bearish On Bitcoin Despite Headwinds—Here’s Why The upper level....
Over the years, there have been different metrics, technicals, and ways in which investors have tried to predict the Bitcoin price bottom with each bear market. Some of these have reportedly done so with some accuracy, while others have seen a deviation. Recently, a pseudonymous crypto analyst who goes by @cryptocupra on the X (formerly Twitter) platform has shared their own bottom prediction, using a 23-Bar Theory. How Bitcoin Bottoms Go In The Past In the post shared on the social media platform, the crypto analyst explained that there have been 23 bars that have predicted the bottom of....
The Bitcoin price has once again entered the spotlight after a market analyst argued that a major cyclical signal has already appeared, potentially setting the stage for a move toward $320,000. According to a post by @CryptoTice on X, the recent market structure suggests that Bitcoin has already completed its latest cycle bottom, positioning it for another move toward the upper boundary of a long-term price channel. Bitcoin Price Channel Points Toward $320,000 The analyst’s view is based on a long-term upward channel that has guided Bitcoin’s price movement for years. In this pattern,....
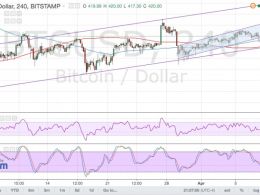
Bitcoin price might be able to test the 4-hour channel bottom if the short-term support breaks down. Bitcoin price is currently stalling at the 100 SMA, which might hold as a dynamic support level. Speaking of moving averages, the 100 SMA is still above the longer-term 200 SMA so the path of least resistance is to the upside and the uptrend could resume at some point. Meanwhile, the 200 SMA lines up with the bottom of the 4-hour channel support and could also hold as the line in the sand for any rallies. A break below this area could set off a downtrend. RSI is treading sideways, barely....
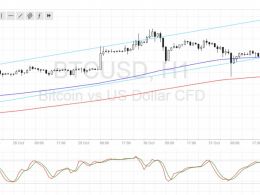
Bitcoin price is resuming its climb after testing the bottom of the ascending channel visible on the 1-hour chart. Bitcoin Price Key Highlights. Bitcoin price continues to trend higher on its 1-hour time frame, moving on a sharper ascending channel than before. Price just bounced off the channel support and seems to be setting its sights on the resistance around $740-750. Technical indicators are suggesting that further gains are in the cards. Technical Indicators Signals. The 100 SMA is safely above the longer-term 200 SMA on this time frame, confirming that the path of least resistance....