
Why Every Bitcoin Macro Triangle Breakdown Has Led To A Retracement Phase
Across multiple market cycles, Bitcoin has shown a consistent technical pattern that often goes unnoticed until it’s already underway. Whenever price breaks down from a macro triangle structure, it has historically marked the beginning of a broader retracement phase rather than an immediate recovery. These large-scale consolidation formations often signal periods of compression, where price action tightens as the market prepares for a decisive move. How Large-Scale Consolidation Patterns Form On The Bitcoin chart The Bitcoin behavior is following a macro triangle breakdown that has....
Related News

Bitcoin has faced strong rejection around the $76,000 resistance zone, signaling that bullish momentum is beginning to fade at higher levels. With selling pressure increasing and key support levels now in focus, the market is entering a critical phase where a breakdown could start to take shape if buyers fail to regain control. Rejection At $74,000–$76,000 Caps Bitcoin’s Momentum Bitcoin faced a firm rejection after pushing into the $74,000–$76,000 resistance zone, highlighting strong selling pressure at the top of the range. The inability to sustain momentum above this region suggests....
Bitcoin is facing a critical juncture as its macro retracement converges with a tight mid-range battle between $86,000 and $100,000. With bearish patterns confirmed and short-term support holding, the market now waits to see if bulls can reclaim momentum or if a deeper pullback is on the horizon. Bitcoin Confirms Macro Top: Bearish Phase Underway According to an update from Crypto Patel, Bitcoin appears to have confirmed a market top and is now transitioning into a broader macro retracement phase. The loss of a key bullish support level has shifted the market structure into a bearish....

Network outages and decreasing smart contract reserves add further downside pressure to SOL price. Solana (SOL) is nearing a decisive breakdown moment as it inches towards the apex of its prevailing "descending triangle" pattern.SOL's 40% price decline setupNotably, SOL's price has been consolidating inside a range defined by a falling trendline resistance and horizontal trendline support, which appears like a descending triangle—a trend continuation pattern. Therefore, since SOL has been trending lower, down about 85% from its November 2021 peak of $267, its likelihood of breaking below....
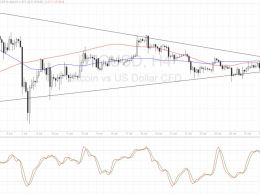
Bitcoin price made a sharp breakdown from consolidation recently, signaling that a longer-term downtrend could take place. Bitcoin Price Key Highlights. Bitcoin price was trading inside a symmetrical triangle pattern before a strong breakdown ensued. An early signal for this selloff materialized on the 1-hour time frame when price broke below a head and shoulders pattern. Economic reports released last Friday seemed to be the main catalyst for the big move. Technical Indicators Signals. The 100 SMA and 200 SMA are still oscillating, as the moving averages have yet to incorporate the recent....
Crypto analyst @Ripple_Effect11 predicts an imminent XRP price crash in a new technical analysis shared via X. His prediction is underpinned by a bearish breakout from a major triangle pattern that has been forming since the $3.84 all-time high on January 4, 2018. The analysis paints a dark picture for XRP in the coming months, with a potential drop to as low as $0.07, contingent on certain technical events. Why The XRP Price Could Crash To $0.07 Elliott Wave Theory, which forms the basis of @Ripple_Effect11’s analysis, is a form of technical analysis that predicts future price....