
Has The Bitcoin Price Hit Its Bottom? Key On-Chain Data Signals Potential Reb...
Following a significant downturn that saw Bitcoin (BTC) plunge to the $80,000 mark on November 21, the leading cryptocurrency has managed to stabilize above this critical threshold for several days. This development has sparked speculation about whether this level represents a short-term bottom and if a new upward trend might follow. Potential Local Bottom For Bitcoin According to analysis from CryptoQuant analyst Carmelo Aleman, on-chain data indicates a market landscape characterized by institutional redistribution, structural weakness, and signs of a rebound that may hint at a local....
Related News

Bitcoin price remains stuck below its former all-time high set five years ago. The shocking decline has been one of the worst crypto winters on record, and the market is bracing for continued meltdown. However, a series of on-chain indicators in BTC could provide clues to how close we are to a bottom. Let’s take a look. A Series Of Six On-Chain Indicators Shout: Bitcoin Bottom Is In Bear markets are brutal in Bitcoin or otherwise, because the bottom is only known in hindsight. The feeling that markets will fall forever, creates a fear that freezes investors from buying at long-term....

The biggest question so far in the bear phase has been when and where the Bitcoin price will bounce back. According to the latest on-chain data, there might be a fresh answer as to where the price bottom will be in the current bear market. Here’s Why $40,000 Could Be Pivotal To The Bear Market […]
Bitcoin continues to trade within a narrow range, hovering around $66,500 going into the week. While price action still appears subdued, recent on-chain data suggests this period of consolidation could be signaling the formation of a market bottom. Supply In Profit Drops To 11.3 Million BTC In a Quicktake post on the CryptoQuant platform, on-chain […]
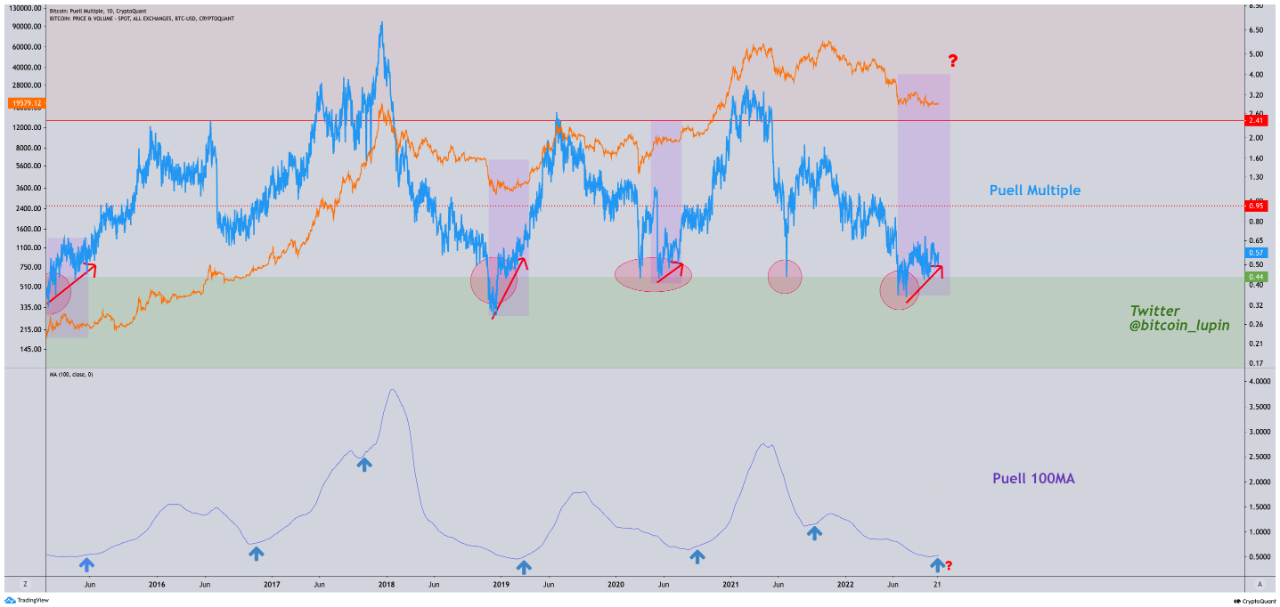
On-chain data shows the Bitcoin Puell Multiple has been going up recently after having formed a possible bottom. Here’s what history says could happen next for the crypto’s price. Bitcoin Puell Multiple 100MA Has Bounced Off A Potential Cycle Bottom As pointed out by an analyst in a CryptoQuant post, BTC miners seem to be […]
The XRP price may be approaching a decisive turning point after fresh on-chain data revealed one of the most extreme capitulation events in years. According to Santiment analysis, XRP has just recorded its largest realized loss spike since 2022, a development that has previously preceded a major price recovery. The data is now fueling expectations that a bottom could be in, with a move back above $2 increasingly within reach if history repeats. XRP Price Bottom Signals Emerge After Historic Loss Spike Santiment’s weekly Network Realized Profit/Loss chart, which tracks five years of XRP....