
Analyst: Chainlink Forms Most Bullish Setup Ever as Chance of Upside Grows
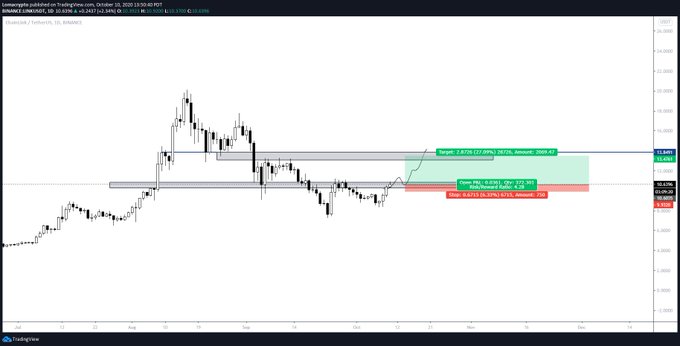
Chainlink has been consolidating within the mid-$12.00 region following its recent surge higher. The break into this price region has been significant, and where it trends next will likely depend on its reaction to the resistance established at $13.00. Yesterday, it was able to surge to this resistance level before facing some selling pressure that […]
Related News

Chainlink continues to hold its ground above key support levels, keeping the broader market cautiously optimistic. Despite recent indecisive candles, the setup suggests that one strong bullish move could quickly shift sentiment and reignite momentum toward higher targets. Chainlink Faces Mixed Signals As Monthly Candle Closes Bearish In his Chainlink daily technical outlook, crypto analyst CryptoWzrd began by reviewing the higher timeframes, noting that the monthly candle for LINK closed slightly bearish. Additionally, the LINK/BTC pair closed its monthly candle indecisively, reflecting a....
An analyst has pointed out how Chainlink is forming a TD Sequential sell signal right now, which could lead to a retracement to this level. Chainlink Could Decline To $12.50 Following The Sell Signal As explained by analyst Ali in a new post on X, LINK could be heading toward a correction based on what the TD Sequential signal says. The “Tom Demark (TD) Sequential” is a popular indicator in technical analysis that is used to pinpoint reversals in the price of any asset (which, in the current discussion, is naturally Chainlink). The metric gives a signal whenever the asset has....
CryptoWzrd noted in a fresh update that Chainlink ended the day on a bullish note, with signs pointing to more upside ahead. The strength in LINKBTC is adding momentum, suggesting further pressure from the bulls. On the intraday chart, the $22 level is emerging as the next key bullish zone, while lower time frames remain the focus for spotting the next scalp opportunity. LINKBTC To Trigger A Reversal For Chainlink In an elaborate analysis, CryptoWzrd confirmed a strong bullish close for both the price of Chainlink and the LINK/BTC pairing. Notably, the LINK/BTC pair printed a powerful....
Chainlink (LINK) has experienced a strong decline after peaking at around $20 in August. At the recent lows, the coin traded around as low as $8, meaning that it had declined by 60%. LINK may be poised to revert to its bullish stance though as the coin forms a bottom formation, analysts say. Related Reading: […]
Sharing his daily technical outlook, CryptoWzrd noted in a recent post that Chainlink (LINK) ended the session bullish, hinting at the possibility of further upside. With LINKBTC rebounding from an extreme oversold zone, LINK could be gearing up for its next move upwards. Bullish Daily Close For Chainlink And LINKBTC CryptoWzrd, expanding on his latest analysis, explained that both Chainlink and LINKBTC closed the day with bullish daily candles, a sign that momentum could be building in favor of buyers. This positive structure on higher time frames indicates that sentiment may be shifting....