Bitcoin Consolidates Losses, Why 100 SMA Holds Is The Key
Bitcoin price started a downside correction below $65,000 against the US Dollar. BTC must climb above the 100 hourly SMA and $66,500 to start a fresh increase. Bitcoin started a downside correction below the $66,000 and $65,000 levels. The price is now trading below $66,000 and the 100 hourly simple moving average. There is a key contracting triangle forming with resistance near $65,200 on the hourly chart of the BTC/USD pair (data feed from Kraken). The pair could start a fresh increase if there is a clear break above $66,000 and the 100 hourly SMA. Bitcoin Price Consolidates Below $66K....
Related News
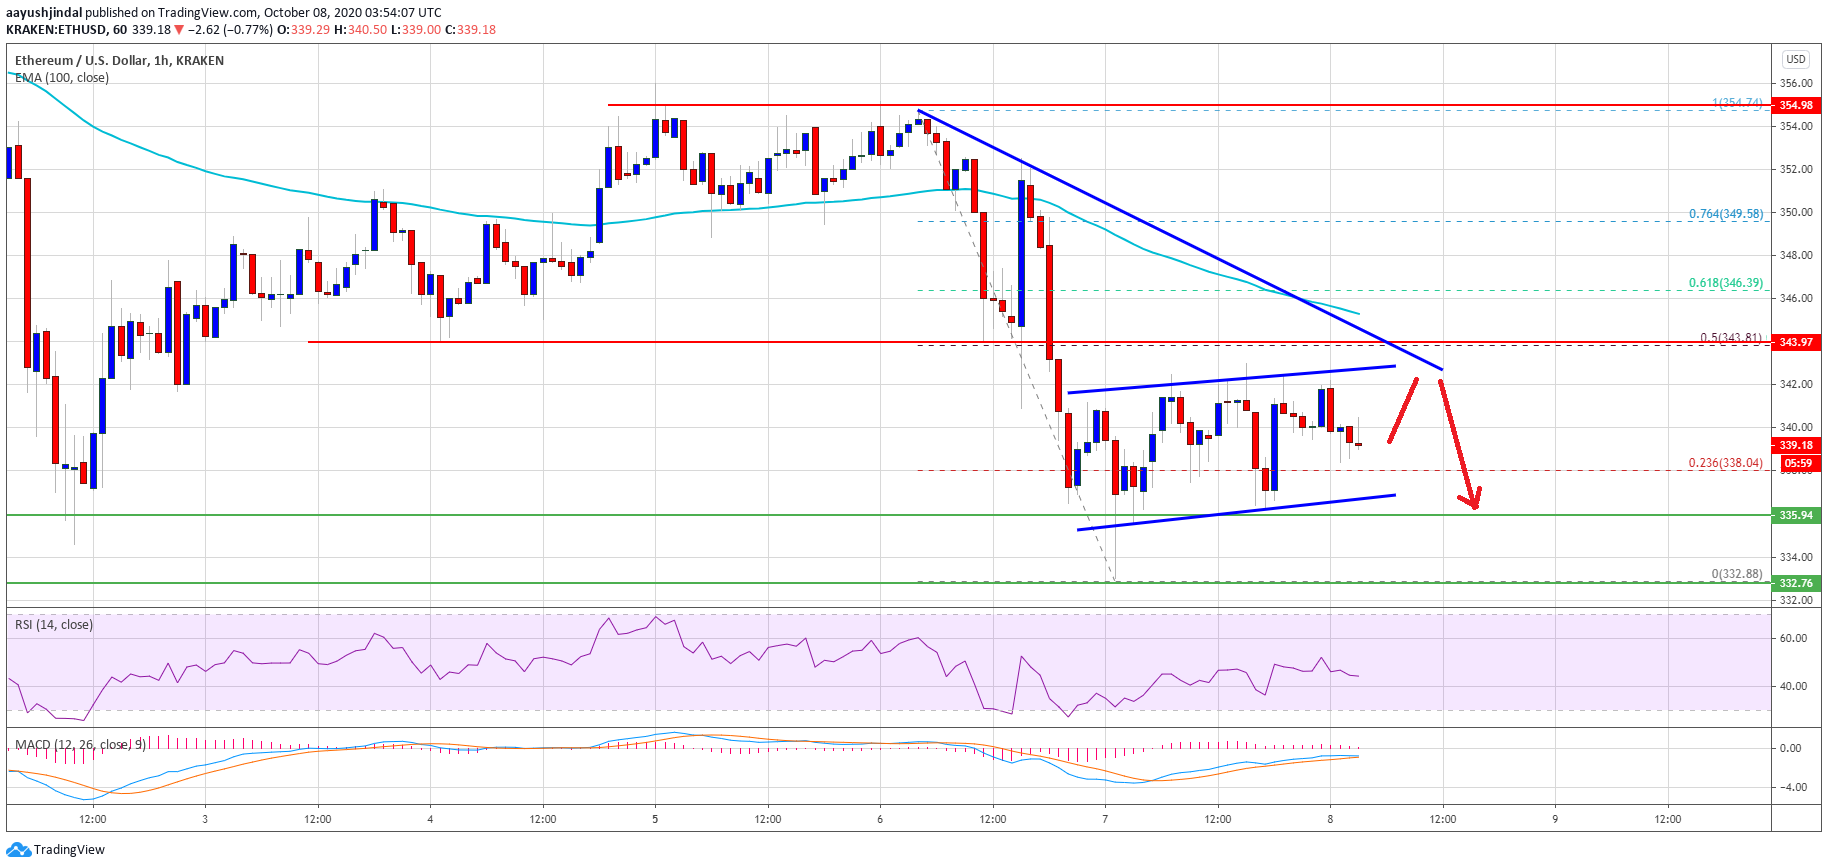
Ethereum is currently consolidating losses below the $350 pivot against the US Dollar. ETH price remains at a risk of a sharp decline unless it surges past $345 and $350. Ethereum traded as low as $333 and it is currently consolidating losses. The price is facing a major resistance near $345 and the 100 hourly […]
Bitcoin has not had the best couple of things and altcoins have been subjected to the same fate too. The market has continued to succumb to pressure being mounted by various social issues, from the Canada protests to the brewing conflict between Ukraine and Russia. In all of this, however, bitcoin has mounted better resistance and this is apparent in the data. Bitcoin Holds Ahead Of Indexes Bitcoin has once again proven to be the best bet when the market is in turmoil. With the recent downtrend, all of the indexes have suffered, just like bitcoin, but the latter has held up better in the....
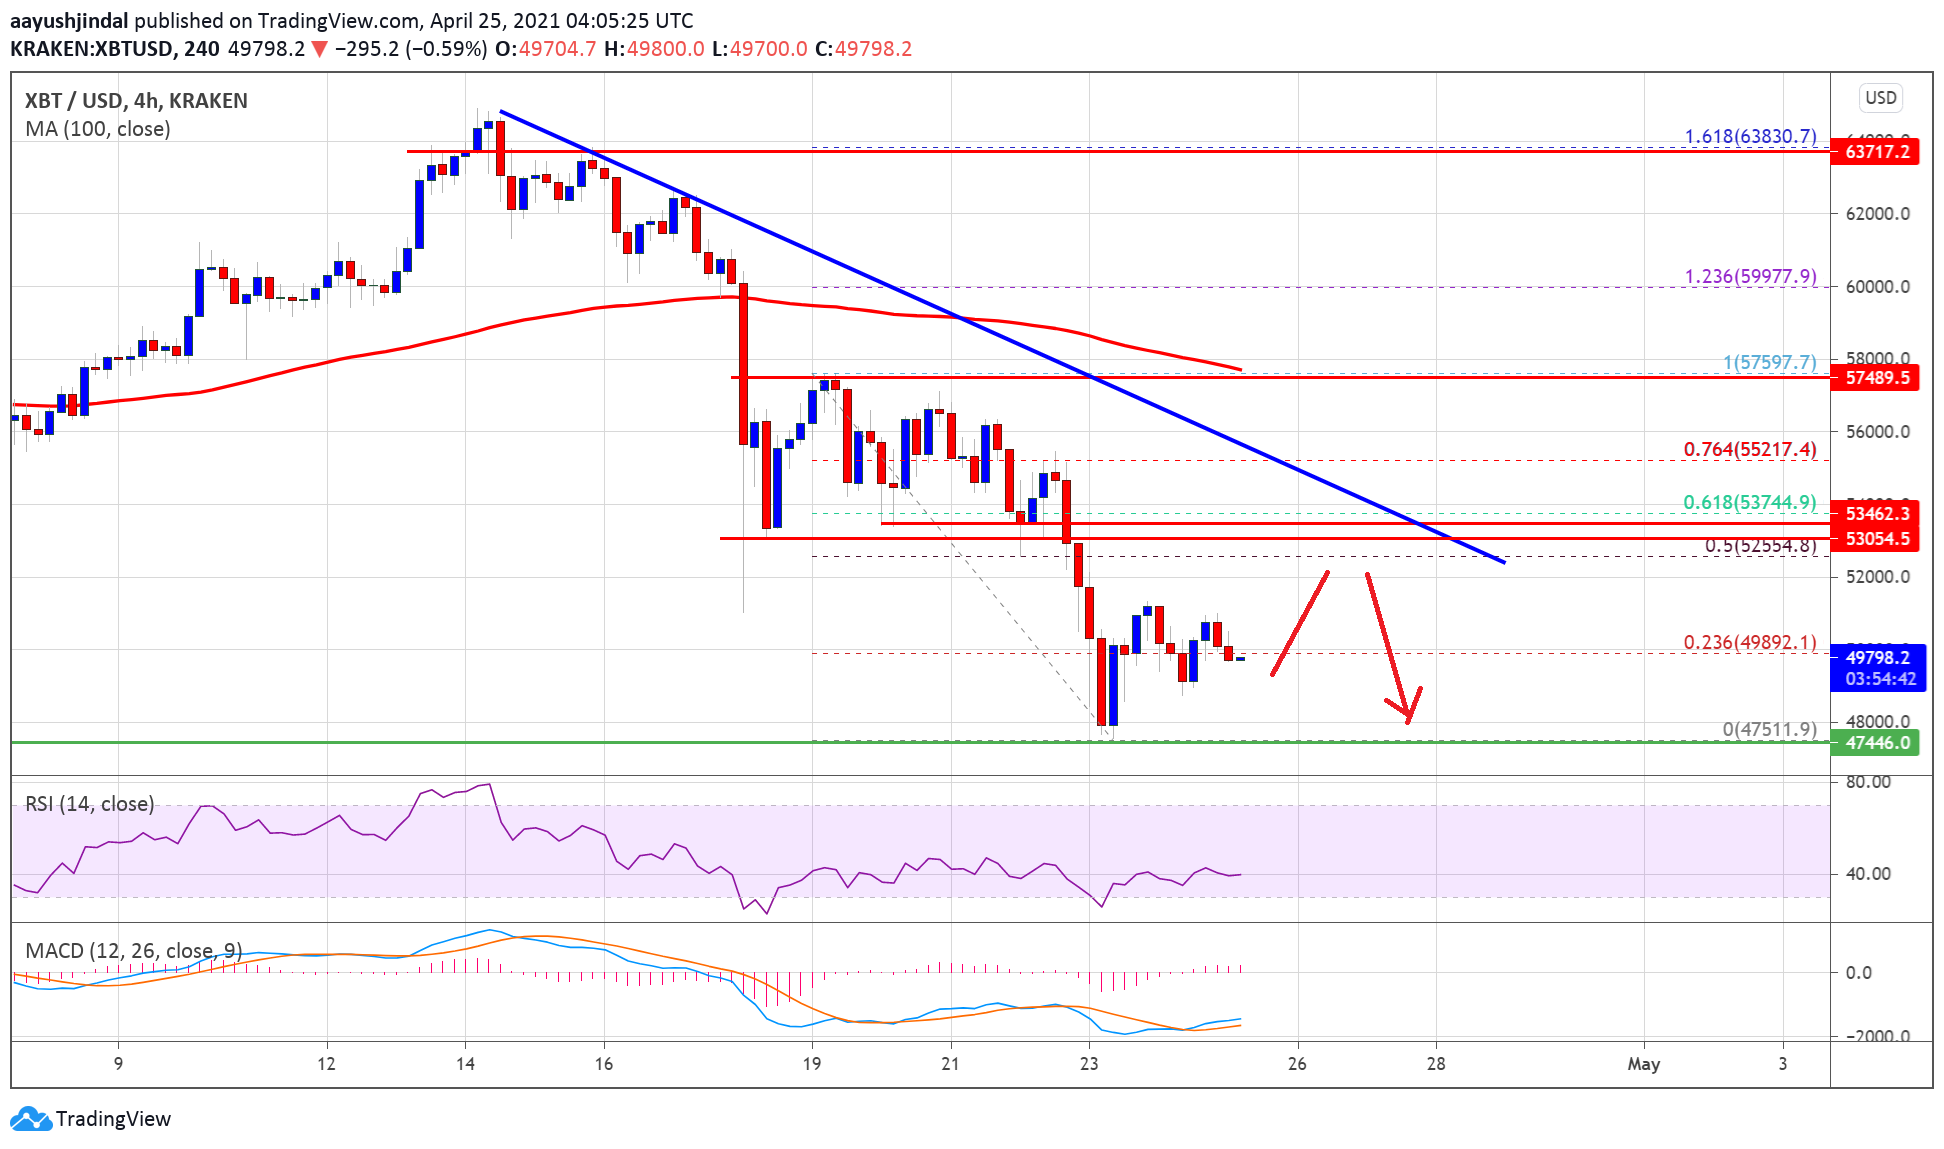
Bitcoin price extended its decline below the $50,000 support against the US Dollar. BTC is now consolidating losses and it remains at a risk of more downside below $48,000. Bitcoin declined heavily below the $52,000 and $50,000 support levels. The price is now trading well below $52,000 and the 100 simple moving average (4-hours). There […]
It has been a rough past few days for altcoins, with many posting capitulatory losses as Bitcoin continues struggling to garner any sustained upwards momentum that can send it past its $13,800 resistance. Despite the lack of momentum seen by BTC, it remains incredibly strong from a technical perspective, and there’s no real justification for […]
Solana declined and tested the $128 support zone. SOL price is consolidating losses and might aim for a fresh increase above the $132 resistance. SOL price started a consolidation phase from the $128 zone against the US Dollar. The price is now trading below $135 and the 100-hourly simple moving average. There is a connecting bearish trend line forming with resistance at $132 on the hourly chart of the SOL/USD pair (data source from Kraken). The pair could gain bullish momentum if it clears the $132 resistance zone. Solana Price Holds Support Solana price started a fresh decline from the....


