
Ethereum At A Crossroads: Price Testing The Lower Boundary Of A Key Chart Pat...
Since the beginning of this year, Ethereum has underperformed compared to major digital assets in the market. ETH’s underperformance has sparked concerns within the community, with traders finding it difficult to determine whether the altcoin is gearing up for a major rally or further downside pressure. However, current price action shows that ETH might be […]
Related News

An analyst has pointed out how Ethereum has seen a sell signal on the Tom Demark (TD) Sequential alongside the retest of a key resistance line. Ethereum Is Trading Around Upper Boundary Of Descending Channel In a new post on X, analyst Ali Martinez has talked about how Ethereum is looking from a technical analysis (TA) perspective. First, Martinez has pointed out that ETH has been trading inside a Descending Channel for the last couple of months. Related Reading: Bitcoin STH Whale Profits Hit $10.1 Billion, Highest For The Cycle The Descending Channel refers to a consolidation pattern that....
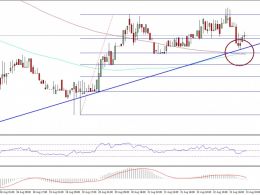
Ethereum price is currently correcting lower and testing a major support, which must hold if ETH/USD has to remain in an uptrend. Key Highlights. ETH price after trading as high as $11.20 against the US Dollar found sellers and corrected lower. There is a crucial bullish trend line formed on the hourly chart (data feed via SimpleFX) of ETH/USD, which is acting as a major support. The same trend line is also around the 100 hourly simple moving average, acting as a buy area. Ethereum Price Trend Line Support. Ethereum price ETH managed to trade higher once again towards the $11.20 level....
Dogecoin (DOGE) is testing the lower boundary of a long-term triangle pattern, a move that could determine its next major price direction. A new technical analysis highlights a roadmap with key recovery levels and outlines a potential timeframe when selling and profit-taking may become favorable. Dogecoin Triangle Pattern Signals Recovery Path In a recent X post, crypto analyst Jonathan Carter presented a new analysis of Dogecoin’s price action, predicting that a potential recovery may be imminent. Carter explained that Dogecoin is currently testing a critical support area around....
Dogecoin is trading inside a well-defined falling wedge on the 12-hour chart, with one technical analyst arguing that an upside breakout could trigger an 80–90% rally into the upper $0.20 range. In a fresh DOGE/USDT update shared on November 25, 2025, trader Clifton Fx (@clifton_ideas) posted a Binance 12-hour chart that spans back to late July. Dogecoin Could Rally Nearly 90% The chart is dominated by two descending trendlines that enclose price action. The upper boundary connects successive lower highs from early autumn through late November, forming a downward-sloping resistance line....

Key Highlights. Dogecoin price is possibly trading at a major crossroads, as there is a range formed on the hourly chart. Secondly, the price is currently testing a monster bearish trend line formed on the 4-hours chart. A break above the highlighted trend line and resistance area may trigger an upside rally. Dogecoin price is above the 100 simple moving average (4-hours chart), which may encourage buyers to break the trend line and resistance area. Break likely? Dogecoin price recovered well recently, as it traded above a major hurdle of 35.0 Satoshis, and the 100 MA on the 4-hours chart....