
Can This Bitcoin Ratio Have Hints For A Bottom?
Past trend of the Bitcoin actual/realized price ratio may be forming a pattern that could hint at a possible bottom for the crypto at $17k. Bitcoin Actual/Realized Price Ratio Currently Has A Value Of 0.8 As pointed out by an analyst in a CryptoQuant post, historical data of this BTC ratio may have interesting implications for the current market. The realized cap is a capitalization model for Bitcoin that multiplies each coin in the circulating supply with the price at which the coin was last moved and takes the sum of all the values. This is different from the usual market cap, where the....
Related News
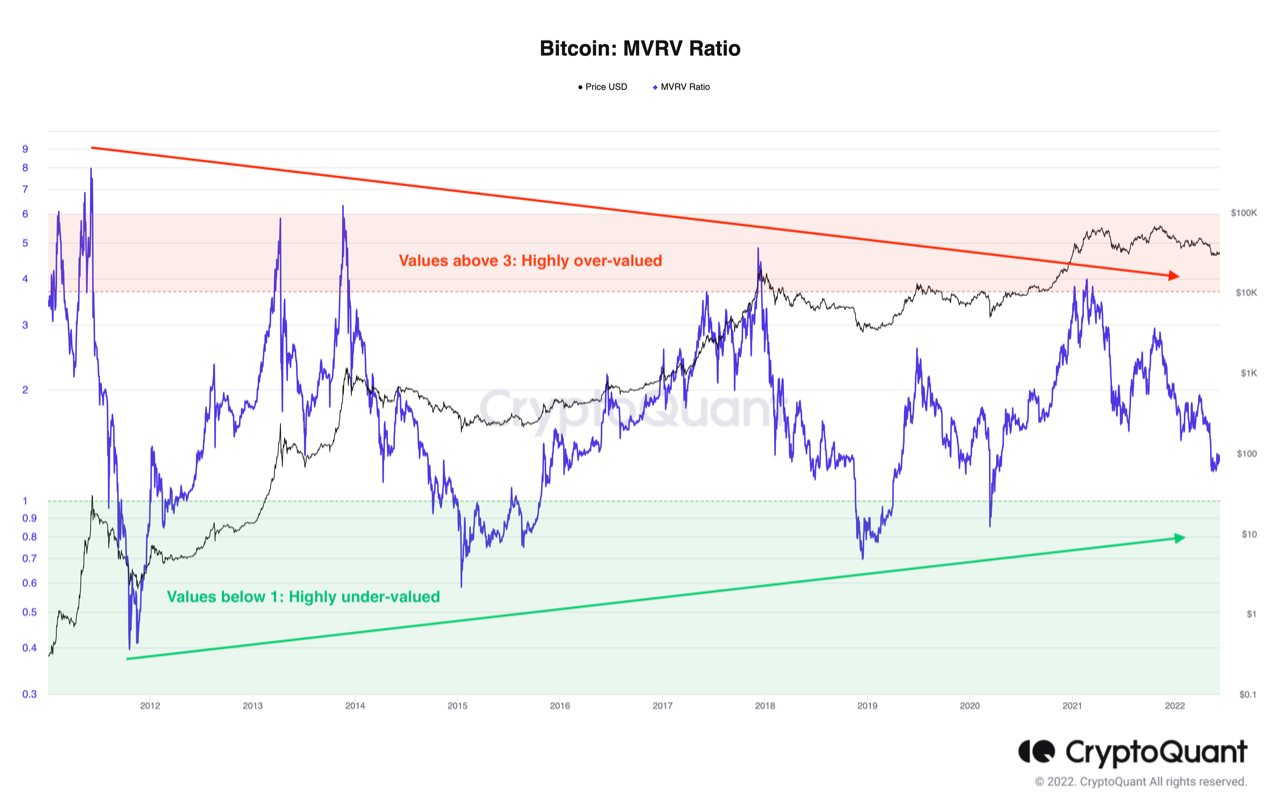
Data shows the Bitcoin MVRV ratio has gone down recently, but the metric’s value is still above the historic bottom zone. Bitcoin MVRV Ratio Observes Decrease, But Value Still Greater Than 1 As explained by an analyst in a CryptoQuant post, BTC may still have room for further decline before the bottom is in. The […]

According to on-chain data, current Bitcoin SOPR trend suggests the market may be nowhere near the price bottom. Bitcoin SOPR Still Some Distance Above The “One” Level As pointed out by an analyst in a CryptoQuant post, the BTC SOPR hints there may be some ways to go still before a bottom forms. The “spent output profit ratio” (or SOPR in brief) is an indicator that tells us whether investors are selling at a profit or a loss right now. The metric works by evaluating the history of each coin on the chain to see which price it was last moved at. If this price was....
In this episode of NewsBTC’s daily technical analysis videos, we examine how Bitcoin might have bottomed precisely at the 1.618 Fibonacci extension, using Elliott Wave Theory. Take a look at the video below: VIDEO: Bitcoin Price Analysis (BTCUSD): September 29, 2022 Using the Fibonacci retracement tool not for retracement but for extensions, we have found a golden discovery using math. Related Reading: Bitcoin & The Global Currency Meltdown | BTCUSD September 28, 2022 Did Bitcoin Bottom At The Golden Ratio? In Elliott Wave Theory, corrections come in ABC patterns. Taking the....

Bitcoin and other assets often develop support and resistance around Fibonacci levels, either through extensions or retracement. The ratios are based on the Fibonacci sequence, which has ties to the Golden Ratio. With the top cryptocurrency so tied to mathematics, the Golden Ratio could provide clues as to where Bitcoin is in its latest market […]

The MVRV ratio, a Bitcoin indicator, might suggest that the current bull run isn’t over, and the price of the crypto is yet to peak. The MVRV Ratio Indicates The Cycle Isn’t Over Yet As pointed out by a Crypto Quant post, past cycles seem to follow a specific pattern on the MVRV charts. This might suggest that the current bull run hasn’t peaked yet. MVRV stands for “Market Value to Realized Value”. The ratio is defined as Bitcoin’s market capitalization divided by realized capitalization. Related Reading | SpaceX Has Bitcoin On Its Balance Sheet,....