
Ethereum Price Approaches Key $3K Test, Recovery Momentum at Inflection Point
Ethereum price started a recovery wave above $2,850. ETH faces resistance near $3,000 and might start a fresh decline in the near term. Ethereum started a recovery wave above $2,800 and $2,850. The price is trading above $2,850 and the 100-hourly Simple Moving Average. There is a key bearish trend line forming with resistance at $2,970 on the hourly chart of ETH/USD (data feed via Kraken). The pair could continue to move down if it settles below the $2,840 zone. Ethereum Price Faces Resistance Ethereum price managed to stay above $2,650 and started a recovery wave, like Bitcoin. ETH price....
Related News

Bitcoin is likely about to visit a key inflection point, historical data shows. Philip Swift, a crypto-asset analyst, recently noted that over the past four years, Bitcoin has undergone a crucial reversal in the middle of December, namely between December 15th and 18th. This cyclicality would suggest that Bitcoin is likely to undergo an inflection point come the middle of December. Bitcoin to See a Key Inflection Point, Historical Data Shows Bitcoin is likely about […]
Ethereum (ETH) is currently facing a critical test as it approaches the key support level of $3,360. This price point has emerged as a significant marker in recent trading sessions, with market participants closely watching to see if ETH can maintain its footing or if further declines are imminent. The $3,360 level represents a crucial […]
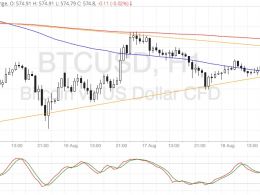
Bitcoin price looks ready to break out of its symmetrical triangle consolidation pattern, which could determine its longer-term direction. Bitcoin Price Key Highlights. Bitcoin price has been stuck in consolidation for a while, forming lower highs and higher lows inside a symmetrical triangle pattern. Price is currently testing support and is approaching the peak of the pattern, which suggests that a breakout could take place soon. Technical indicators seem to be favoring a downside move at this point. Technical Indicators Signals. The 100 SMA is still below the 200 SMA so the path of....
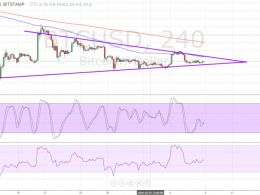
Bitcoin price could test the top of the triangle, which might hold as resistance since it coincides with the 100 SMA and is coming off a strong downtrend. The 100 SMA is below the longer-term 200 SMA so the path of least resistance is to the downside. This suggests that the $390-400 area might keep gains in check, pushing bitcoin price back to the bottom of the triangle at $370-375. Stochastic is on its way up, after just making it out of the oversold region. This indicates that bullish pressure is present and that buyers could attempt to push past the triangle resistance. If so, price....
The Bitcoin, Ethereum, and XRP prices are showing signs of recovery as traders across regions take sharply different approaches to the latest price swings. Fresh market data reveals that buying and selling pressure is no longer evenly distributed throughout the day, with the United States emerging as the key source of support. At the same […]