
Ethereum Price Looks Tired – Could Upside Momentum Fade Soon?
Ethereum price started a fresh decline from $4,765. ETH is now trading below $4,650 and might extend losses if it stays below $4,620. Ethereum is now correcting gains below the $4,650 zone. The price is trading below $4,620 and the 100-hourly Simple Moving Average. There is a bearish trend line forming with resistance at $4,610 on the hourly chart of ETH/USD (data feed via Kraken). The pair could start a fresh increase if it settles above $4,620 and $4,650. Ethereum Price Dips Again Ethereum price started a fresh decline after it failed to clear the $4,765 zone, like Bitcoin. ETH price....
Related News

Ethereum has shown signs of strength after completing a healthy pullback. Having met and retested its $4,811 target, ETH is now holding firm, suggesting the correction phase may be over. If buyers regain control, the path could open for a powerful rally in the near term. Ethereum Pulls Back, But Bullish Signals Confirm Strength Javon Marks, in his most recent update, emphasized that ETH reached the $4,811.71 target before entering a pullback phase. Despite the temporary dip, bullish signals have re-emerged, indicating that ETH has regained strength and could soon retest this important....

Ethereum is currently trading around critical price levels as the market shifts into a new phase. The momentum that propelled ETH higher earlier this year has started to fade, with the asset now entering a consolidation period. While some altcoins have managed to post modest gains and Bitcoin continues to trade sideways, Ethereum’s price action […]
Ethereum price started a fresh increase and remained stable above $2,350. ETH is now consolidating and might aim for more gains if it clears $2,425. Ethereum started a steady increase above the $2,380 zone. The price is trading above $2,350 and the 100-hourly Simple Moving Average. There is a bullish trend line forming with support at $2,320 on the hourly chart of ETH/USD (data feed via Kraken). The pair could continue to move up if it stays above the $2,320 zone. Ethereum Price Corrects Recent Gains Ethereum price managed to stay above the $2,250 support and started a fresh increase, like....
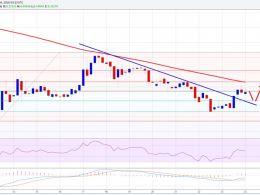
Ethereum price looks like broke a major resistance area. Buying dips may be favored as long as ETH/USD is above the $8.00 support area. Ethereum price after a nasty decline against the US Dollar found support near $7.50. There was a nice upside reaction once the price gained momentum, and during the upside drift the ETH/USD managed to break a bearish trend line formed on the 4-hours chart (data feed via Kraken). It is important to note that the recent bounce came from the 76.4% Fib retracement level of the last wave from the $7.00 low to $9.67 high. So, we can say that a correction phase....
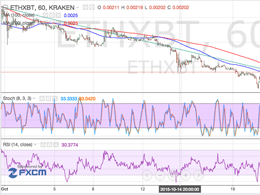
Ethereum Price Key Highlights. Ethereum price had been trending steadily lower on long-term and short-term time frames, but an upside break from the descending trend line on the 1-hour chart suggests that a reversal might be in order. Price popped above the moving averages to a high of 0.00237BTC and has since retreated for a retest of the broken resistance. Ethereum price may be on the verge of a reversal from its earlier downtrend, indicated by the trend line breakout on a short-term chart. Sights Set on Next Resistance. If the uptrend gains traction, ethereum price could head up to the....