TA: Ethereum Bears Keep Pushing, Why ETH Could Slide Further
Ethereum failed to clear the $3,650 resistance against the US Dollar. ETH price is moving lower and it might extend its decline below $3,450 in the near term. Ethereum struggled to gain strength above the $3,600 and $3,620 levels. The price is now trading below $3,550 and the 100 hourly simple moving average. There is a key declining channel forming with resistance near $3,550 on the hourly chart of ETH/USD (data feed via Kraken). The pair could slide towards $3,350 unless it breaks the $3,550 resistance zone. Ethereum Price Faces Hurdles Ethereum failed to settle above the $3,600 pivot....
Related News
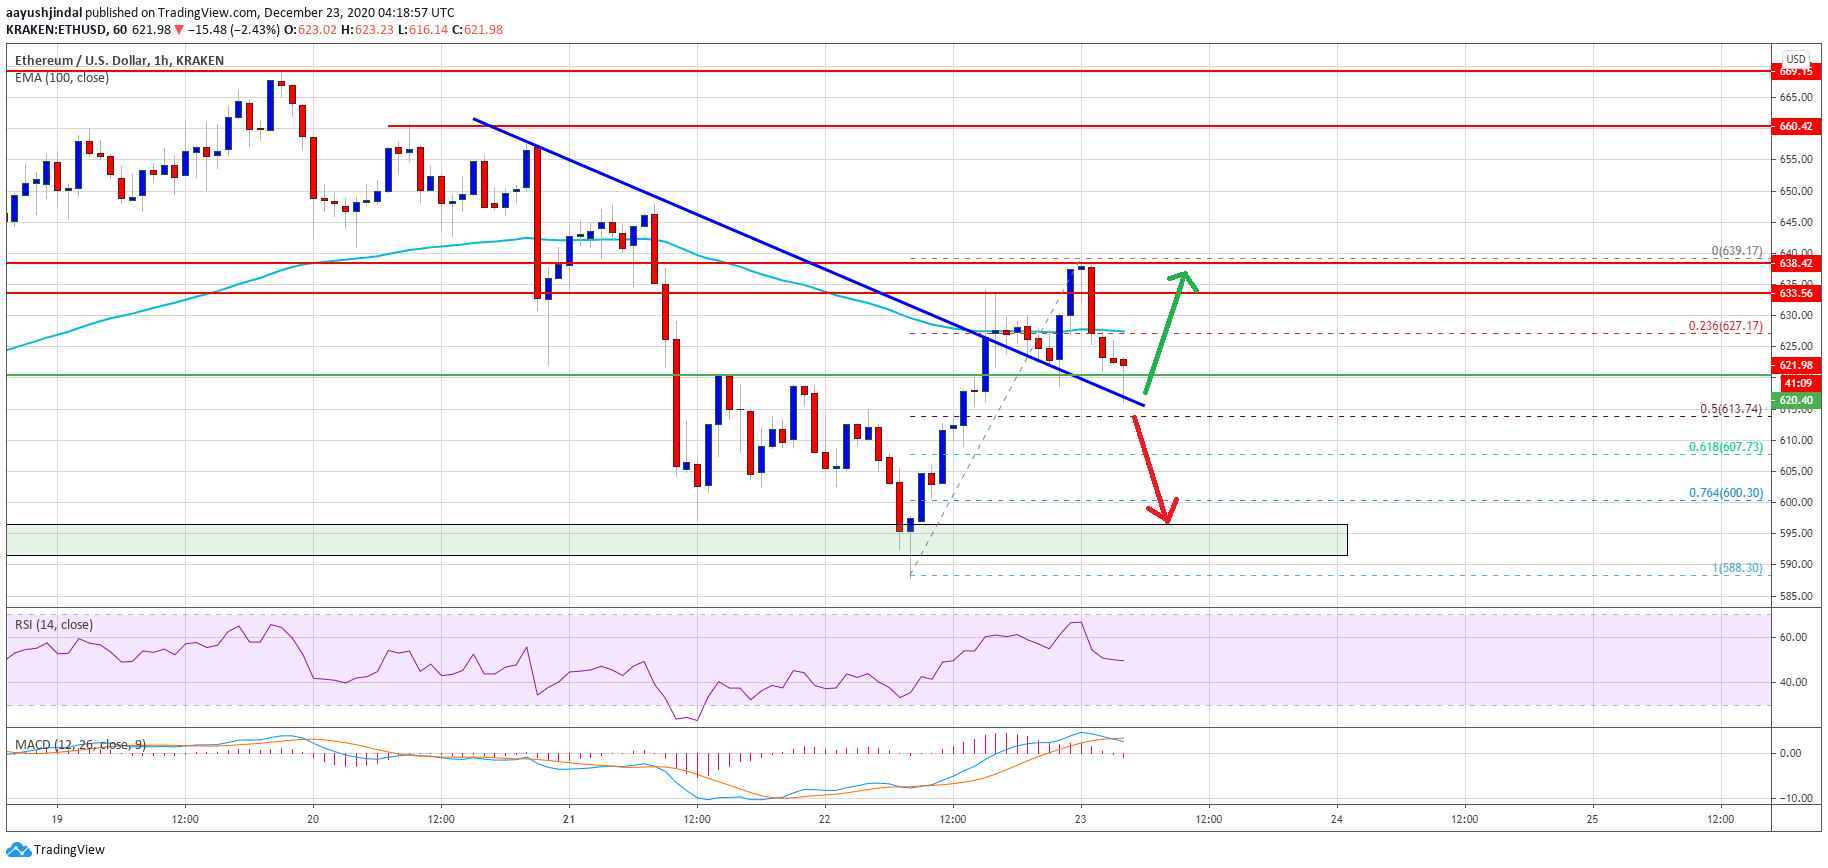
Ethereum started a decent upward move above $620 and $630 against the US Dollar. ETH price failed to clear $640 and it is currently struggling to stay above $620. Ethereum remained well bid above the $590 zone and recovered above $620. The price is now consolidating near $620, but it is below the 100 hourly […]
Ethereum has witnessed some intense selling pressure following its latest push higher, with bulls trying to defend $600 as bears aim at pushing it below this level The selling pressure here has proven to be quite intense throughout the past few days, but bulls have been able to absorb all of it and continue pushing it higher Where the rest of the market trends in the near-term will depend largely on the $600 level and […]
Bitcoin is seeing some intense strength today, with bulls pushing the cryptocurrency towards $17,000 following a brief bout of weakness earlier this week. The ongoing uptrend has marked a significant extension of the trend seen throughout the past few months, with bears being unable to gain any ground against bulls as it continues pushing higher […]
Ethereum price started a fresh recovery wave above the $4,350 zone but failed. ETH is still struggling and might slide below the $4,270 zone. Ethereum is still struggling to recover above the $4,400 zone. The price is trading below $4,350 and the 100-hourly Simple Moving Average. There was a break below a bullish trend line with support at $4,290 on the hourly chart of ETH/USD (data feed via Kraken). The pair could start a strong decline if it settles below the $4,220 level in the near term. Ethereum Price Could Slide Further Ethereum price started a recovery wave after it formed a base....
Ethereum Price Key Highlights. Ethereum price is gaining downside momentum as it proceeds to create new record lows below 0.00211BTC. No reversal candlesticks are in sight just yet, indicating that the selloff could carry on. Ethereum price seems to be aiming for new lows, as more sellers hopped in on the recent break from consolidation. Technical indicators are also suggesting that further losses are likely. Not yet oversold? On the daily chart of ethereum price, stochastic and RSI are still pointing down, which suggests that price can keep heading south. Shorter-term time frames don't....


