
Bitcoin Price Rally Slows, Consolidation Signals Possible Next Move
Bitcoin price started a steady increase above $70,500 and $72,500. BTC is now consolidating and might aim for a fresh increase above $72,500. Bitcoin started a fresh increase after it settled above the $70,000 zone. The price is trading above $70,000 and the 100 hourly simple moving average. There is a bullish trend line forming with support at $69,000 on the hourly chart of the BTC/USD pair (data feed from Kraken). The pair might dip again if it trades below the $70,000 and $69,000 levels. Bitcoin Price Starts Downside Correction Bitcoin price extended its increase above the $68,500 zone.....
Related News
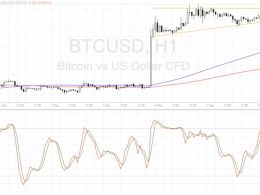
Bitcoin price is still moving in tight consolidation, but this appears to be a continuation signal from the previous strong move. Bitcoin Price Key Highlights. Bitcoin price is still stuck in consolidation, as traders are waiting for bigger market catalysts before deciding which direction to take. Keep in mind that bitcoin just recently made a strong rally, which makes the consolidation pattern a bullish flag. Technical indicators seem to be suggesting that an upside breakout is likely. Technical Indicators Signals. The 100 SMA is above the longer-term 200 SMA on this time frame,....
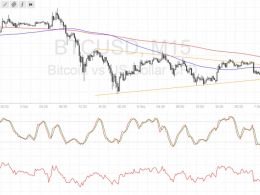
Bitcoin price is stuck in consolidation on its short-term time frames but could be poised for a breakout soon. Bitcoin Price Key Highlights. Bitcoin price has been treading sideways recently and has formed a symmetrical triangle formation on its 15-minute chart. A breakout could be due sooner or later since price is approaching the triangle’s peak. Technical indicators are giving mixed signals on this time frame but longer-term charts suggest that the uptrend could remain intact. Technical Indicators Signals. The 100 SMA is below the longer-term 200 SMA on this chart so the path of least....
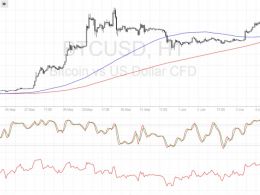
Bitcoin price is gearing up for a strong break of the $600 level, determining if longer-term gains are in the cards. Bitcoin Price Key Highlights Bitcoin price staged such a strong rally on Friday that it’s ready to attempt a break past the latest highs at $600. If this area holds as resistance, bitcoin price could retreat towards support at $550. On the other hand, a move past $600 could put it on track to test the record highs at $1,200. Technical Indicators Signals The 100 SMA is still above the 200 SMA somewhat after nearly making a downward crossover late last week. This signals that....

Bitcoin price has faked advance, and now proceeds to retest the consolidation zone near $570 (Bitstamp). For traders to get themselves in profitable trades, they only need to follow a method and apply the required discipline to stick to their method. And then, evidently, sometimes you have to defy the method! What a life. At xbt,social we saw powerful bullish signals forming in the intermediate timeframe charts, during the past week, but decided on $600 as the trigger to entry. Precisely because the bitcoin market fakes-out prior to advance. The chart signals have been out of sync during....
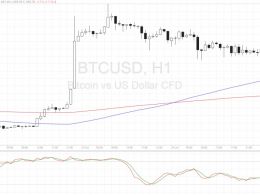
Bitcoin price seems to be regaining bullish momentum after breaking above this short-term consolidation pattern. Bitcoin Price Key Highlights. Bitcoin price recently made a strong rally but fell back in consolidation as bulls struggled to keep the momentum going. Buying pressure seems to be returning since price broke to the upside of the consolidation pattern and appears to have completed a quick pullback. Price could head back to the previous highs from here or carry on with a larger retracement. Technical Indicators Signals. The 100 SMA is still safely above the longer-term 200 SMA....