
4 Signs XRP Is Moving From Bearish to Bullish: Analyst
XRP may be entering a more constructive phase, according to a new thread via X from market analyst Ali Martinez (@alicharts), who argued on April 21 via X that the asset is showing a “structural trend shift from bearish to bullish.” The case rests on a mix of trend-following indicators, whale accumulation, exchange supply dynamics, and a tightening chart structure that could set up a larger move. 4 Signs XRP Is Turning Bullish Ali’s first signal is a change in the macro trend on the daily chart. In the thread, he said the SuperTrend indicator has now issued its first buy signal since....
Related News

Key Highlights. Dogecoin'a price struggling to gain traction, as there was no bullish momentum to take the price higher. There is a pennant looking pattern forming on the hourly chart (data feed from CEX. IO), which may act as a catalyst for the next move. The bullish signs are greater compared to the bearish signs at the moment, suggesting a break higher is most likely. Dogecoin's price is finding sellers near 31-32 satoshis, which is a major resistance zone and holds the key in the short term. Pennant Pattern and Resistance. There was no real break for Dogecoin's price, as it continued....
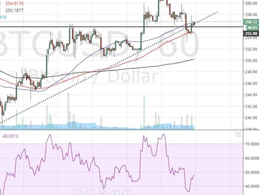
When we entered the April 6th session, we saw bitcoin in multiple bullish breakouts since the end of last week. We also saw that despite these bullish signs in the 1H chart, the technical picture in the 4H chart was still bearish and offered a falling trendline to challenge the bullish attempts. Let's follow up on the technical developments in both time-frames. Bitcoin (BTCUSD) 1H Chart April 7. As we begin the April 7 session, we can see that bitcoin failed to extend above 262. Here are some observations, bullish vs. bearish: Bullish:1) Price is still holding above the 200-, 100-, and....

Crypto analyst Alex Krüger stated that crypto charts ‘look so broken and bearish that is bullish.’ According to the analyst, the recent $BTC and $ETH crash signals it’s time to go long. The charts are also looking good for alt coins: Notice how today’s move was mainly BTC and ETH getting dumped, while alts stopped […]

According to a recent post on X by crypto analyst Rekt Capital, Bitcoin (BTC) may finally be showing early signs of bullish divergence. If this pattern plays out, BTC could target the $101,000 level as its first milestone before moving higher. Bitcoin Showing Signs Of Bullish Divergence? Analyst Weighs In Since the beginning of February, the flagship cryptocurrency has endured multiple macroeconomic uncertainties, including US President Donald Trump’s proposed trade tariffs, the US Federal Reserve’s (Fed) hawkish statements, and the stock market downturn triggered by the release of China’s....

In last week’s post we concluded with the following statement: With our Bearish stance we were expecting to see lows in the vicinity of the U$440-450 zone. Price did fall immediately after the publication but made what can be considered a higher low at US$456 and then another one at US$459 the next day. The big question now is: Are these lows in the Mid US$450’s here to stay for a while or is more downside on the way? So on that note, let’s take a look at the long term picture. We are now changing our view point to Long-Term (tentatively) Bullish, Intermediate -Term Bearish, and Short-Term....