
XRP Price Falls To 4-Month Lows—Charts Signal Sell, On-Chain Data Turns Bearish
The XRP price slid on Wednesday to its lowest level in four months, hitting $1.14. The drop has contributed to a broader soft patch across crypto, and both chart analysis and on-chain indicators are now pointing to a more bearish environment for the altcoin. XRP Price Slips Below Key Averages Market expert Sam Daodu, in a fresh breakdown of what’s driving the move, argued that there currently isn’t much for bulls to lean on. One of the most immediate issues is trend structure. According to Daodu, the XRP price is currently trading below its key moving averages — specifically the 7, 14,....
Related News

Nearly four months after crypto exchange Coinbase and the Federal National Mortgage Association—better known as Fannie Mae—announced their partnership, the companies have now disclosed what they describe as the first-ever mortgage backed by crypto collateral. No Need To Sell Crypto The concept was originally unveiled in March, when Better Home & Finance and Coinbase announced a joint mortgage product designed for prospective homebuyers who hold crypto but struggle with the cash requirements of traditional financing. Instead of requiring customers to liquidate their digital holdings to....
CryptoQuant’s Bitcoin Bull Score Index has dropped to a value of 20, hinting that a potential bearish transition could have occurred for the asset. Bitcoin Bull Score Index Is Now In “Extra Bearish” Territory In a new post on X, CryptoQuant community analyst Maartunn has shared how the analytics firm’s “Bull Score Index” has changed for Bitcoin after its recent price drawdown. The Bull Score Index is an indicator that tells us about the market phase the cryptocurrency is currently going through. It determines this by referring to a bunch of key on-chain....
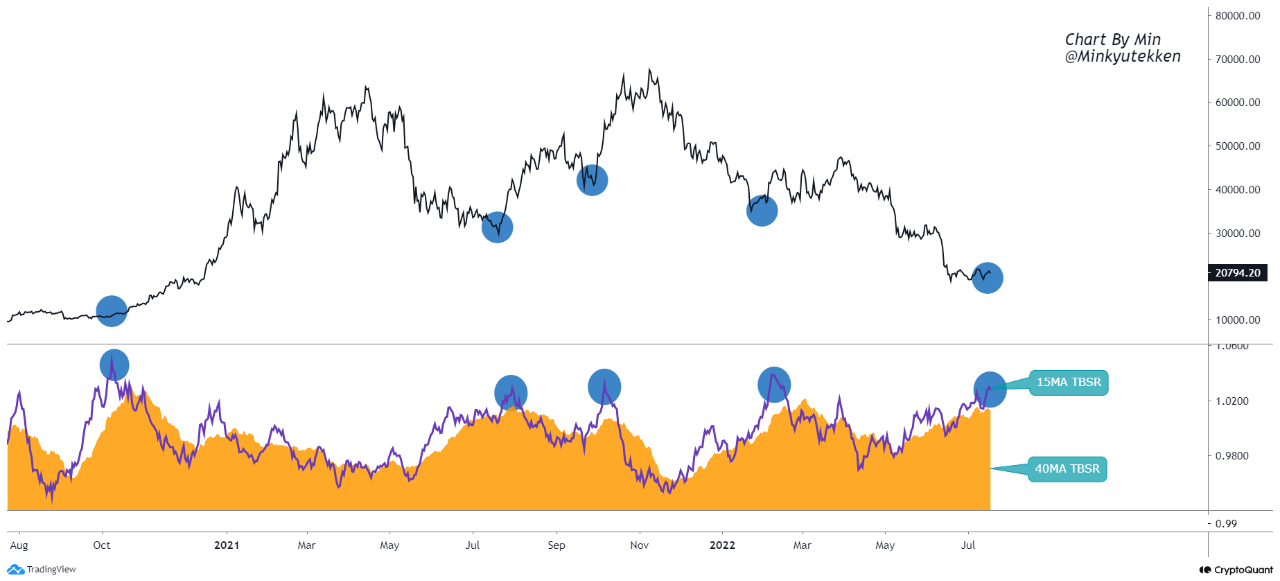
On-chain data shows the Bitcoin taker buy/sell ratio started showing a green signal shortly before the surge above $22k. Bitcoin Taker Buy/Sell Ratio Is Now Showing a “Buy” Signal As pointed out by an analyst in a CryptoQuant post, the BTC taker buy/sell ratio suggested a bounce not too long before the rally today. The […]
Bitcoin recently gave a bearish signal, which ultimately failed to produce a meaningful pullback. Due to the technical failure, historical data suggests that in only a matter of a month BTCUSD could set a new all-time high and reach a target of $85K per coin. Here’s why. Why Failed Bearish Technicals Produce Bullish Breakouts In technical analysis, certain patterns are considered characteristically bearish or bullish. For example, the ascending triangle is a typically bullish-leaning pattern, but only breaks upward 63% of the time. The other 37%, the pattern breaks down bearish. Because of....
An important long-term technical signal is still flashing bullish as Bitcoin approaches an important point on the higher timeframe charts. According to CMT-certified analyst Tony Severino, the monthly SuperTrend indicator for BTCUSD has held support and is yet to display an active sell signal, even with recent market dynamics leading to contention as to whether the cycle has flipped bearish. His chart highlighted an interesting development on the one-month timeframe, where the structure has not yet transitioned into a confirmed sell. Monthly SuperTrend Still In Buy Mode In his post on X,....