
Is XRP Headed For A 16% Drop? Signal Flashes Familiar Warning
Crypto analyst Ali Martinez has cautioned that XRP may be approaching another downswing after the Tom DeMark (TD) Sequential flashed a fresh sell signal on the daily timeframe. In a new video and transcript shared alongside a TradingView chart of the Binance XRP/USDT perpetual contract, Martinez said, “XRP could be bound for a correction. The TD Sequential Indicator on the daily chart has been remarkably accurate in calling XRP’s trend reversals over the past three months, and it has just flashed another sell signal.” Is XRP Poised For A 16%+ Drawdown? Martinez anchored the call in a....
Related News
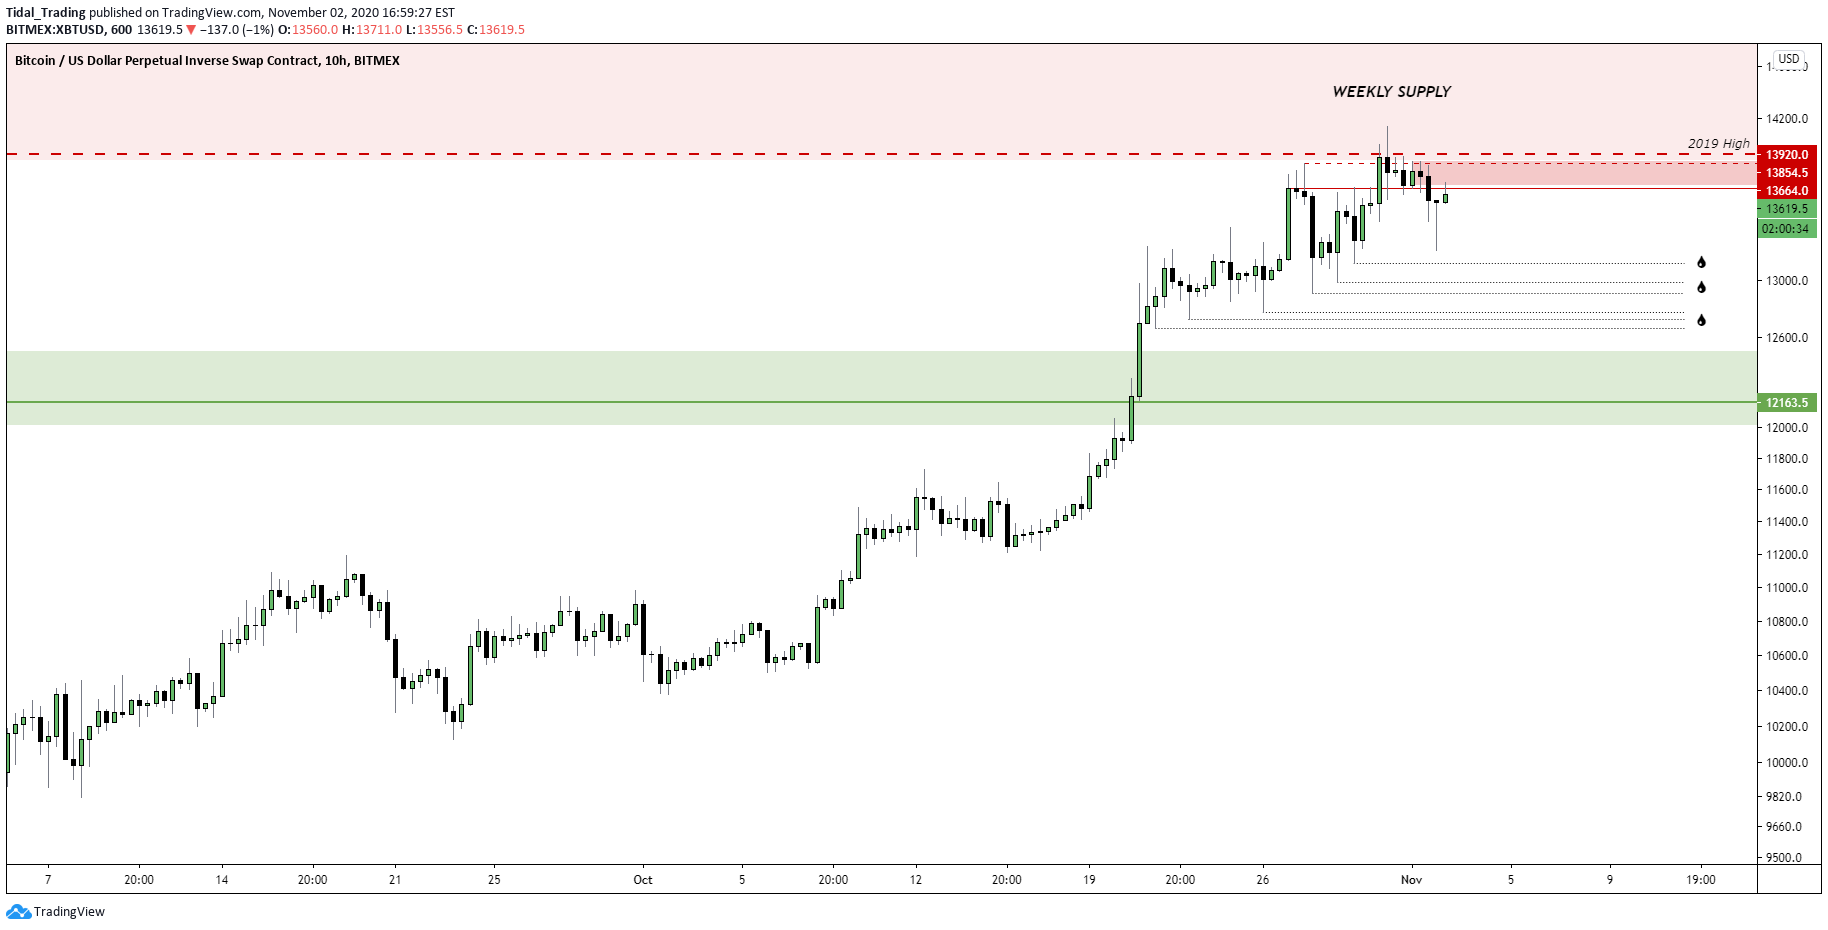
Bitcoin has undergone a strong drop since the weekend highs of $14,100. After failing to pass that pivotal resistance level, the price of the leading cryptocurrency has dropped to $13,400 as of this article’s writing. At the lows of the past 24 hours, BTC traded for $13,200. Analysts think that the coin could move even lower in the days ahead, analysts say. Bitcoin Could Drop Toward $13,000 as Key Bearish Signal Flashes Commenting on Bitcoin’s […]

A crypto analyst has highlighted how the Tom Demark (TD) Sequential has given a buy signal for XRP following its latest pullback. XRP Has Seen A TD Sequential Signal On Its 4-Hour Chart In a new post on X, analyst Ali Martinez has shared a TD Sequential signal that has appeared in the 4-hour price of XRP. The “TD Sequential” here refers to an indicator from technical analysis (TA) that’s generally used for pinpointing potential locations of reversal in an asset’s price. Related Reading: XRP Network Quiet: Adoption & Activity Plunge From 2024 Peak The indicator....

Bitcoin is likely to enter a bearish market as a never-before wrong signal just got triggered. Bitcoin Headed Towards Bear Market? As pointed out by a pseudonymous trader on Twitter, there is a certain signal that has consistently been right in the previous BTC cycles. The signal in question is the Super Guppy indicator, a […]
A crypto analyst has highlighted how the last three golden crosses in the Ethereum MACD led into significant price rallies. This signal has now appeared again. Ethereum MACD Has Just Seen A Potential Golden Cross In a new post on X, analyst Ali Martinez has shared a technical analysis (TA) signal forming in the 1-week price of Ethereum. The signal in question is related to the Moving Average Convergence/Divergence (MACD), a technical indicator that’s generally used for identifying buying and selling points for an asset. Related Reading: USDT, USDC Activity Drops To Lowest Level Of....
A cryptocurrency analyst has pointed out how a rebound could be about to begin for XRP after the Tom Demark (TD) Sequential flashed a buy signal. TD Sequential Has Given A Buy Signal For XRP In a new post on X, analyst Ali Martinez has talked about a TD Sequential signal that has appeared on XRP’s 4-hour price chart. The TD Sequential refers to a technical analysis (TA) indicator that’s generally used for locating points of probable reversal in any asset’s price. The indicator involves two phases: the setup and countdown. In the first of these, it counts up candles of the....